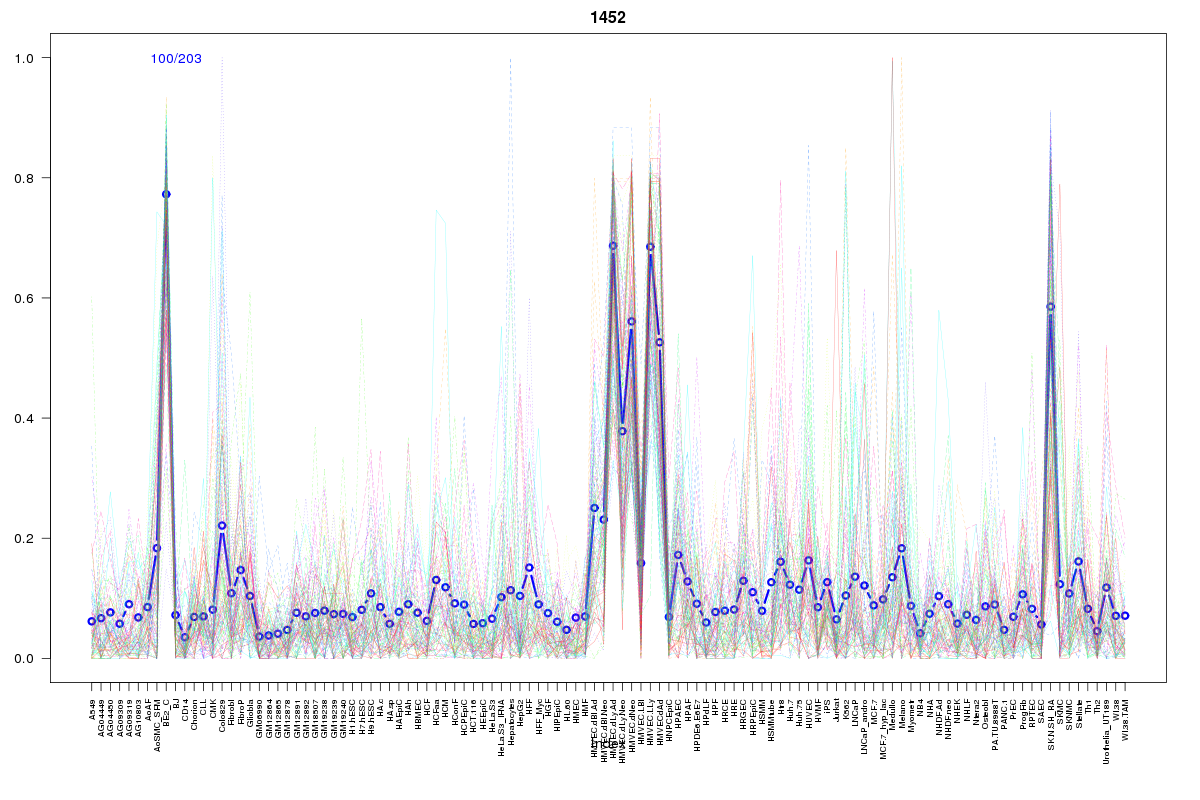
SOM cluster: 1452
Cluster Hypersensitivity Profile

Genomic Location Trend
These plots show the distribution of the DHS sites surrounding the Transcript Start Site of the nearest gene.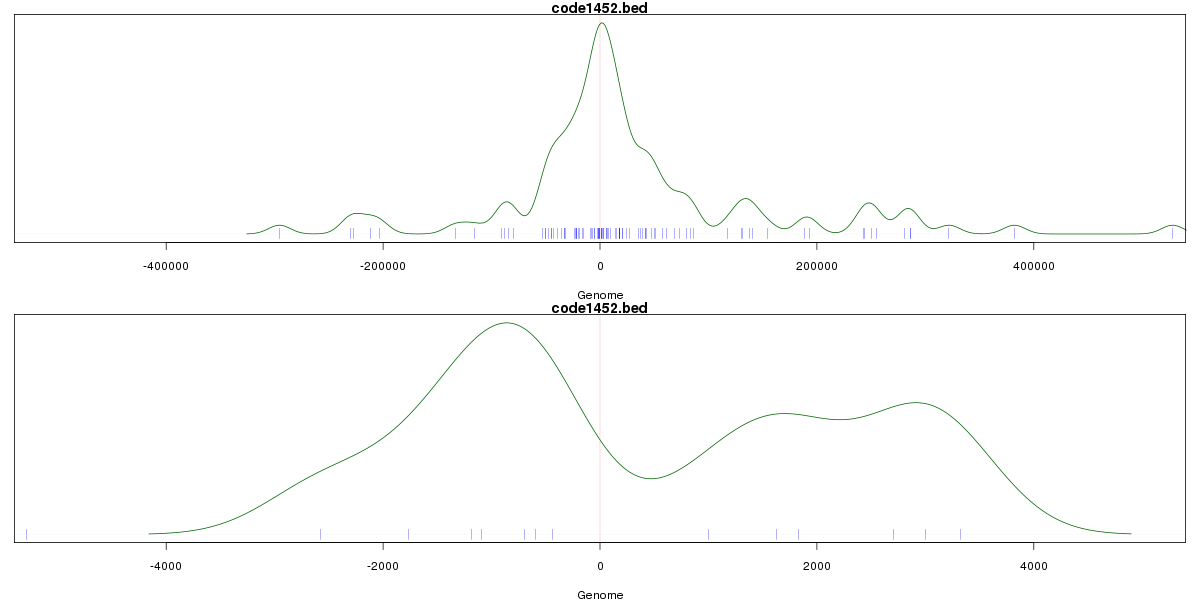
Stats
Number of sites: 203Promoter: 6%
CpG-Island: 0%
Conserved: 58%
Enriched Motifs & Matches
Match Detail: [Jaspar]
|
| ||
|---|---|---|
| Sites: 36/100 | e-val: 0.00000011 | ||
| Factor | e-val(match) | DB |
| EWSR1-FLI1 | 0.000000012138 | JASPAR |
| FEV | 0.000024647 | JASPAR |
| SPI1 | 0.000070709 | JASPAR |
| Stat3 | 0.00015128 | JASPAR |
| TLX1::NFIC | 0.00034261 | JASPAR |
|
| ||
| Sites: 15/100 | e-val: 0.0068 | ||
| Factor | e-val(match) | DB |
| SPIB | 0.00023297 | JASPAR |
| EWSR1-FLI1 | 0.0024812 | JASPAR |
| FEV | 0.0063761 | JASPAR |
| NFATC2 | 0.0091451 | JASPAR |
| znf143 | 0.025165 | JASPAR |
|
| ||
| Sites: 36/100 | e-val: 0.0026 | ||
| Factor | e-val(match) | DB |
| TLX1::NFIC | 0.0000065662 | JASPAR |
| NFATC2 | 0.00022734 | JASPAR |
| REST | 0.00039324 | JASPAR |
| Hand1::Tcfe2a | 0.0024483 | JASPAR |
| NFIC | 0.019252 | JASPAR |
BED file downloads
Top 10 Example Regions
| Location | Gene Link | Dist. |
|---|---|---|
| chr7: 132006220-132006370 | AC018643.4 | 46.01 |
| chr17: 17780660-17780810 | SMCR5 | 51.71 |
| chr5: 148399460-148399610 | SH3TC2 | 60.18 |
| chr22: 19651205-19651355 | TBX1 | 67.39 |
| chr9: 130620580-130620730 | RP11-228B15.4 | 68.66 |
| chr9: 130620580-130620730 | ENG | 68.66 |
| chr3: 37812540-37812690 | AC093415.2 | 69.03 |
| chr12: 89672580-89672730 | DUSP6 | 69.16 |
| chr5: 41264120-41264270 | PLCXD3 | 69.64 |
| chr13: 111023980-111024130 | snoU13 | 70.74 |