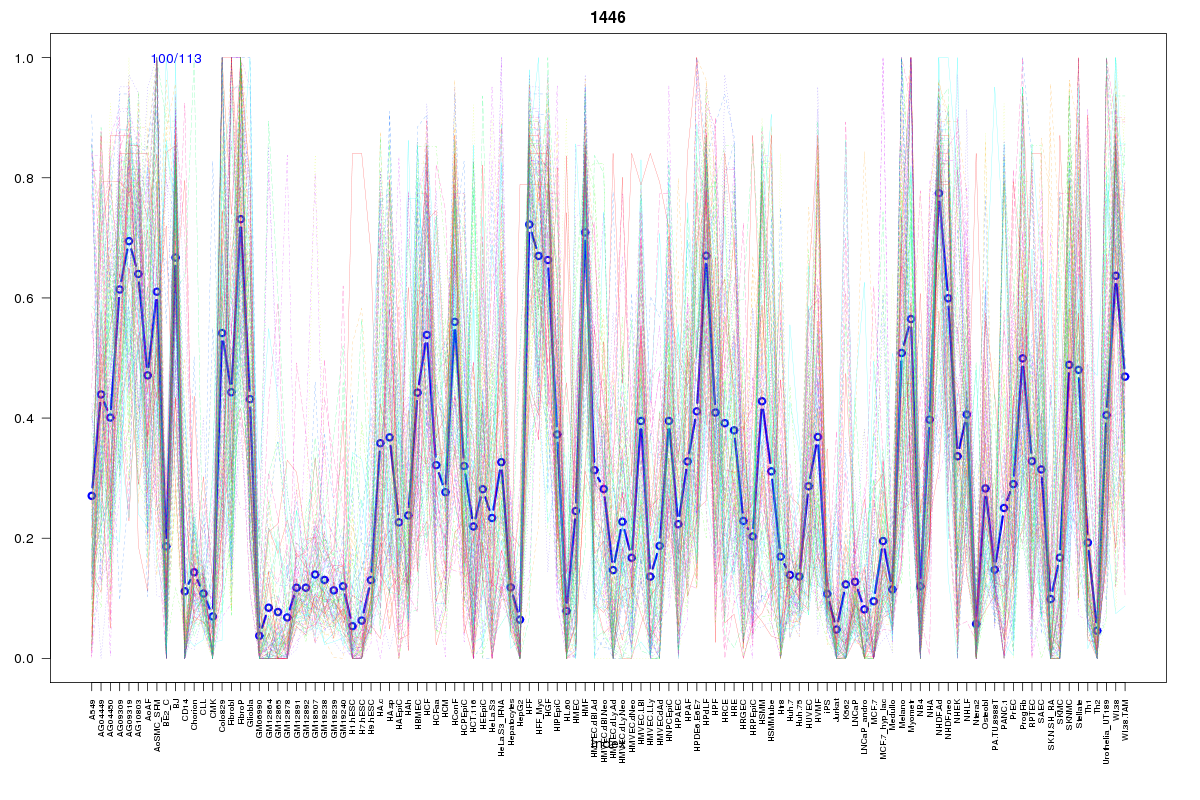
SOM cluster: 1446
Cluster Hypersensitivity Profile

Genomic Location Trend
These plots show the distribution of the DHS sites surrounding the Transcript Start Site of the nearest gene.
Stats
Number of sites: 113Promoter: 2%
CpG-Island: 0%
Conserved: 50%
Enriched Motifs & Matches
Match Detail: [Jaspar]
|
| ||
|---|---|---|
| Sites: 45/100 | e-val: 7.8e-21 | ||
| Factor | e-val(match) | DB |
| AP1 | 0.00000000085608 | JASPAR |
| NFE2L2 | 0.000000066915 | JASPAR |
| NFE2L1::MafG | 0.0045804 | JASPAR |
| PBX1 | 0.0073178 | JASPAR |
| Pax6 | 0.025773 | JASPAR |
BED file downloads
Top 10 Example Regions
| Location | Gene Link | Dist. |
|---|---|---|
| chr1: 92389860-92390010 | BRDT | 5.9 |
| chr1: 92389860-92390010 | TGFBR3 | 5.9 |
| chr8: 67042560-67042710 | CRH | 42.66 |
| chr8: 67042560-67042710 | LINC00967 | 42.66 |
| chr1: 93416920-93417070 | FAM69A | 48.14 |
| chr3: 40588420-40588570 | ZNF621 | 62.77 |
| chr3: 40588420-40588570 | ZNF620 | 62.77 |
| chr1: 145009745-145009895 | PDE4DIP | 66.6 |
| chr20: 48862080-48862230 | CEBPB | 71.06 |
| chr2: 170879300-170879450 | RNU6-1006P | 72.26 |