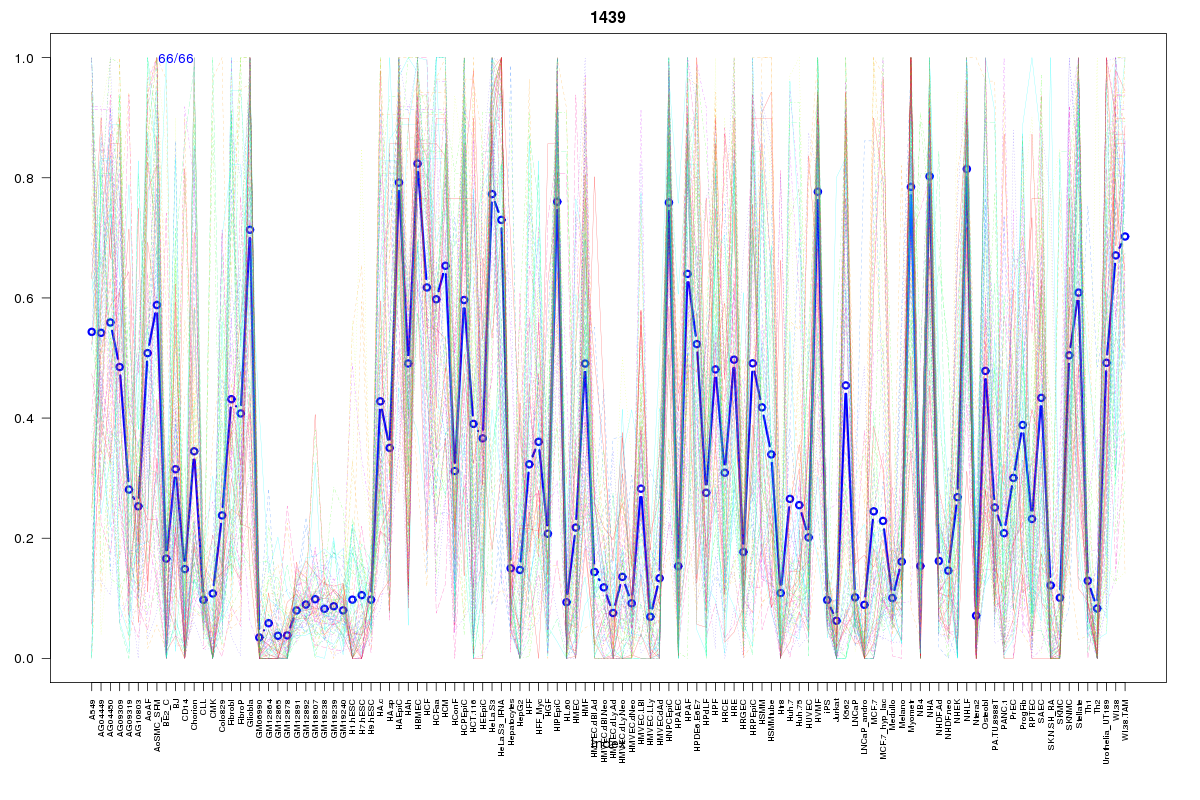
SOM cluster: 1439
Cluster Hypersensitivity Profile

Genomic Location Trend
These plots show the distribution of the DHS sites surrounding the Transcript Start Site of the nearest gene.
Stats
Number of sites: 66Promoter: 2%
CpG-Island: 0%
Conserved: 20%
Enriched Motifs & Matches
Match Detail: [Jaspar]
|
| ||
|---|---|---|
| Sites: 37/66 | e-val: 2.6e-19 | ||
| Factor | e-val(match) | DB |
| AP1 | 0.0000000032828 | JASPAR |
| NFE2L2 | 0.0000000074848 | JASPAR |
| PPARG | 0.0001317 | JASPAR |
| Pax2 | 0.0029121 | JASPAR |
| NR4A2 | 0.0052508 | JASPAR |
|
| ||
| Sites: 7/66 | e-val: 0.82 | ||
| Factor | e-val(match) | DB |
| FOXA1 | 0.00016528 | JASPAR |
| Foxa2 | 0.00091132 | JASPAR |
| FOXO3 | 0.0040556 | JASPAR |
| EWSR1-FLI1 | 0.0065723 | JASPAR |
| Foxd3 | 0.0075892 | JASPAR |
BED file downloads
Top 10 Example Regions
| Location | Gene Link | Dist. |
|---|---|---|
| chr3: 134055520-134055670 | AMOTL2 | 44.88 |
| chr5: 174944960-174945110 | DRD1 | 55.16 |
| chr3: 58079660-58079810 | FLNB | 59.19 |
| chr3: 58079660-58079810 | DNASE1L3 | 59.19 |
| chr2: 121487340-121487490 | GLI2 | 69.88 |
| chr5: 135335240-135335390 | FBXL21 | 72.54 |
| chr5: 135335240-135335390 | TGFBI | 72.54 |
| chr1: 114347480-114347630 | PTPN22 | 77.57 |
| chr1: 114347480-114347630 | BCL2L15 | 77.57 |
| chr6: 43777180-43777330 | VEGFA | 80.99 |