SOM cluster: 1435
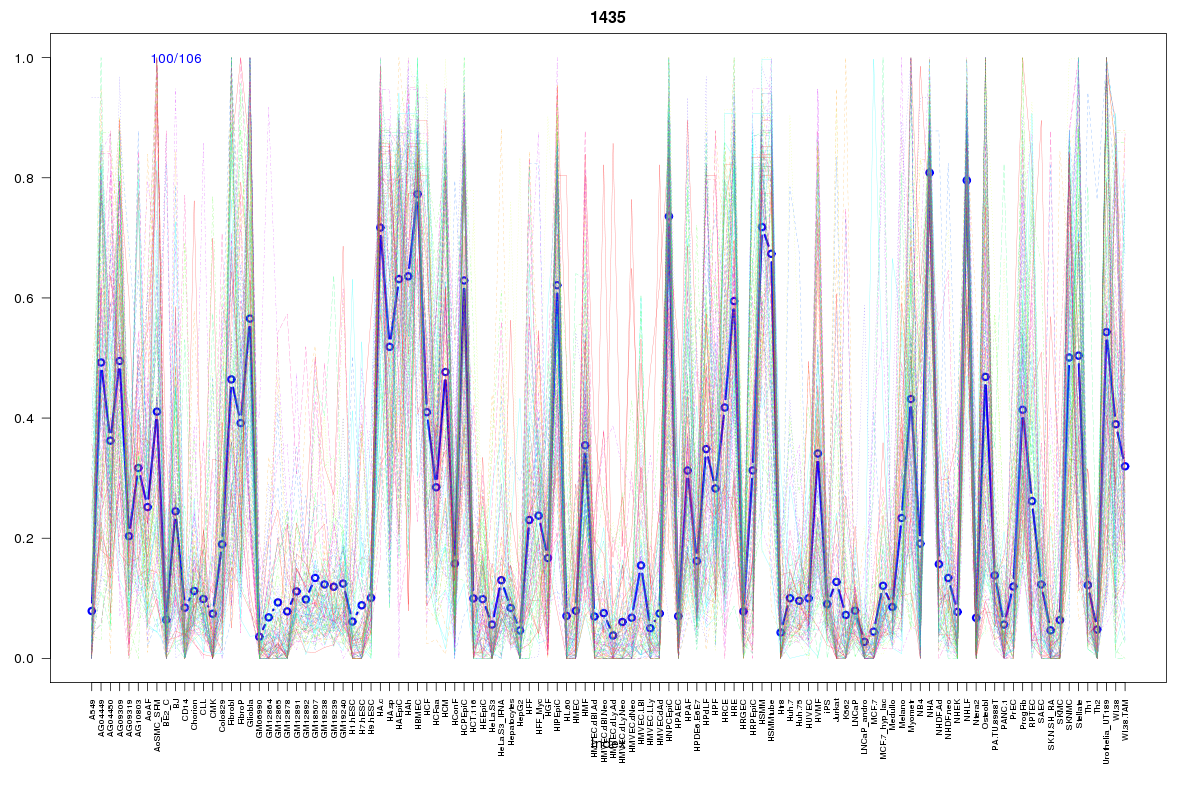
Cluster Hypersensitivity Profile

Genomic Location Trend
These plots show the distribution of the DHS sites surrounding the Transcript Start Site of the nearest gene.
Stats
Number of sites: 106Promoter: 0%
CpG-Island: 0%
Conserved: 28%
Enriched Motifs & Matches
Match Detail: [Jaspar]
|
| ||
|---|---|---|
| Sites: 47/100 | e-val: 1.5e-17 | ||
| Factor | e-val(match) | DB |
| RUNX1 | 0.0000002387 | JASPAR |
| ZNF354C | 0.0088907 | JASPAR |
| RREB1 | 0.014759 | JASPAR |
| FOXA1 | 0.022289 | JASPAR |
| CREB1 | 0.026392 | JASPAR |
BED file downloads
Top 10 Example Regions
| Location | Gene Link | Dist. |
|---|---|---|
| chr8: 37492280-37492430 | ZNF703 | 50.39 |
| chr8: 37492280-37492430 | RP11-863K10.2 | 50.39 |
| chr8: 134104400-134104550 | CTD-2182N23.1 | 56.46 |
| chr12: 26215660-26215810 | RP11-283G6.3 | 59.44 |
| chr12: 26215660-26215810 | RASSF8 | 59.44 |
| chr12: 26215660-26215810 | BHLHE41 | 59.44 |
| chr12: 26215660-26215810 | SSPN | 59.44 |
| chr16: 48442720-48442870 | LONP2 | 64.93 |
| chr4: 7334020-7334170 | SORCS2 | 64.98 |
| chr7: 64002140-64002290 | RP11-561N12.6 | 68.33 |