SOM cluster: 1434
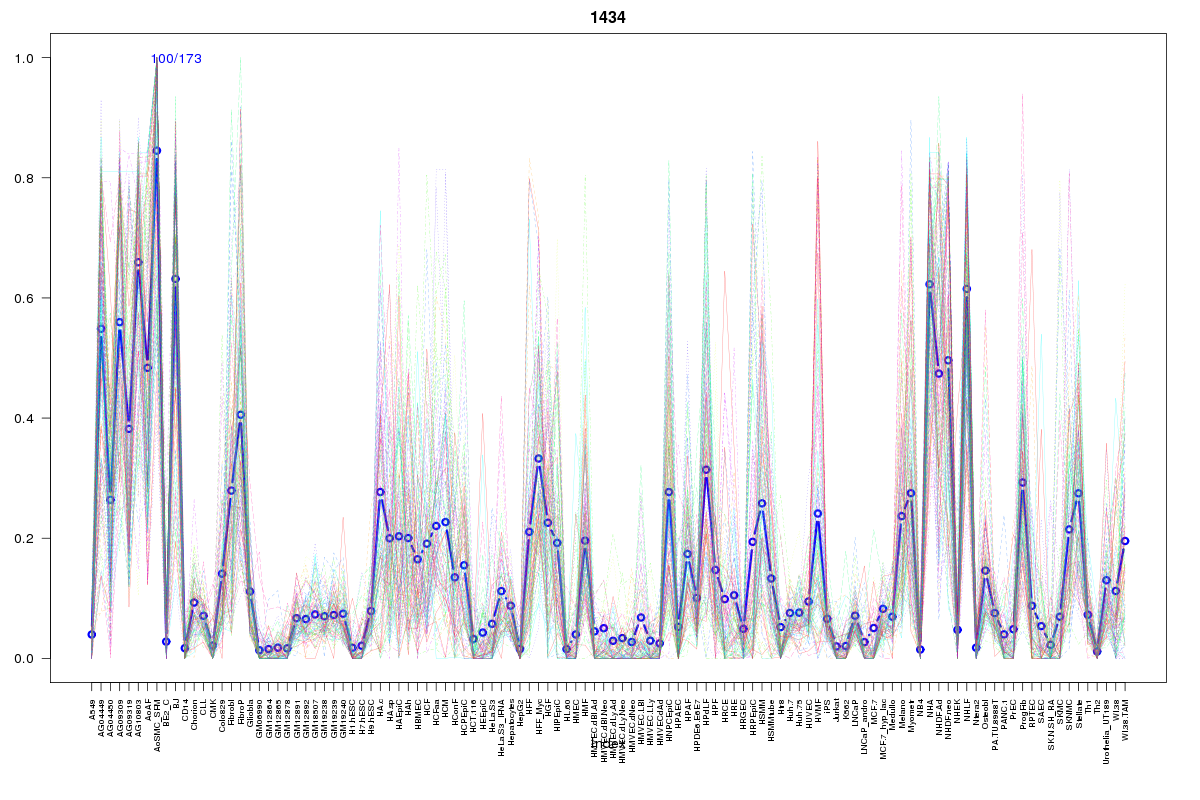
Cluster Hypersensitivity Profile

Genomic Location Trend
These plots show the distribution of the DHS sites surrounding the Transcript Start Site of the nearest gene.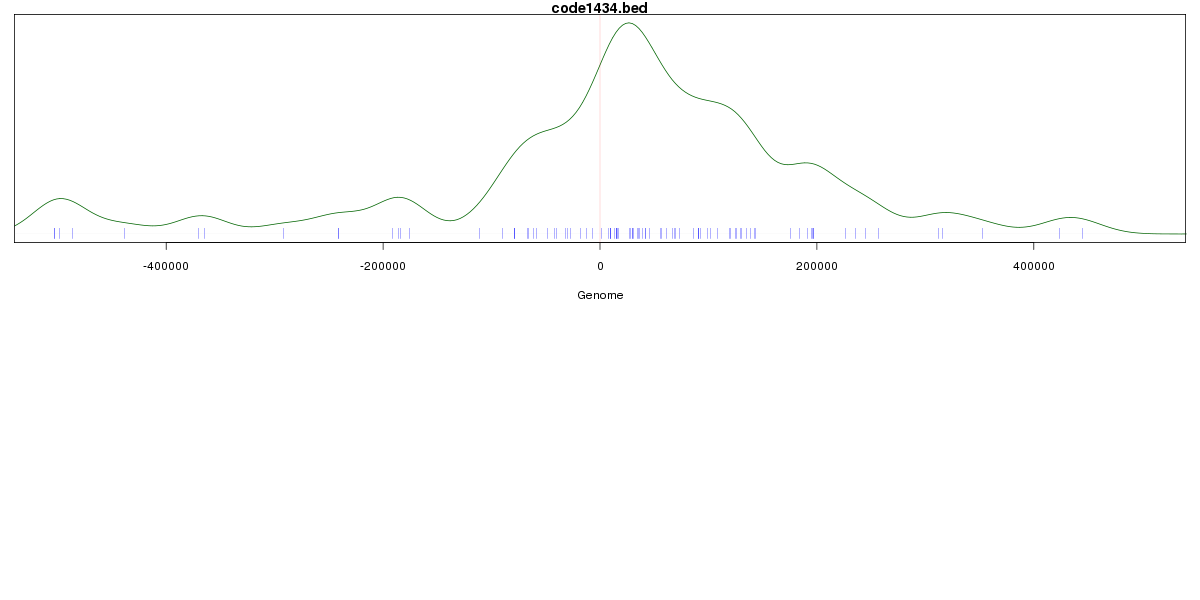
Stats
Number of sites: 173Promoter: 0%
CpG-Island: 0%
Conserved: 52%
Enriched Motifs & Matches
Match Detail: [Jaspar]
|
| ||
|---|---|---|
| Sites: 28/100 | e-val: 0.0000038 | ||
| Factor | e-val(match) | DB |
| Lhx3 | 0.000028132 | JASPAR |
| Prrx2 | 0.00025993 | JASPAR |
| NKX3-1 | 0.0016232 | JASPAR |
| Foxd3 | 0.0038572 | JASPAR |
| HNF1A | 0.0052203 | JASPAR |
BED file downloads
Top 10 Example Regions
| Location | Gene Link | Dist. |
|---|---|---|
| chr3: 155925840-155925990 | KCNAB1 | 33.64 |
| chr12: 76985360-76985510 | OSBPL8 | 34.76 |
| chr12: 76985360-76985510 | RP11-20E24.1 | 34.76 |
| chr1: 204401040-204401190 | PIK3C2B | 45.92 |
| chr1: 204401040-204401190 | MDM4 | 45.92 |
| chr12: 12888360-12888510 | CREBL2 | 47.8 |
| chrX: 3440480-3440630 | PRKX | 49.6 |
| chr3: 123535925-123536075 | MYLK | 52.31 |
| chr9: 115551900-115552050 | SNX30 | 52.92 |
| chr15: 101808025-101808175 | RP11-299G20.2 | 55.6 |