SOM cluster: 1425
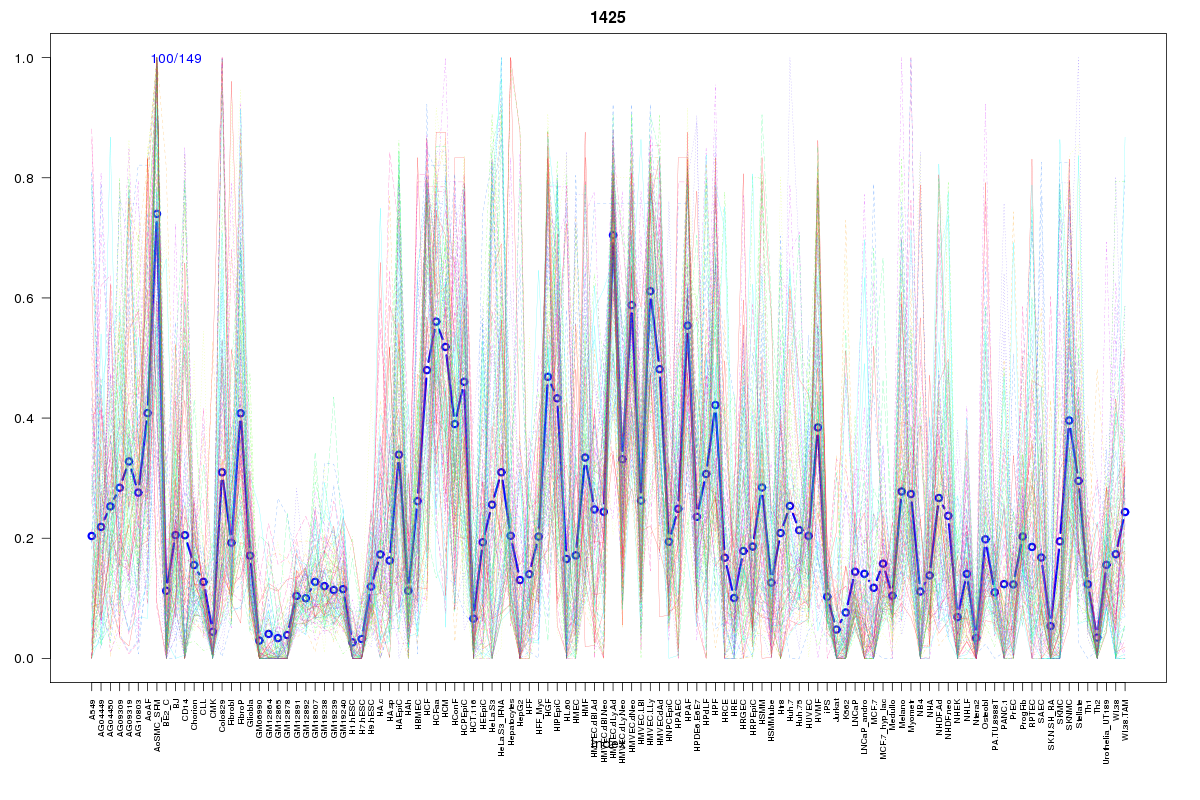
Cluster Hypersensitivity Profile

Genomic Location Trend
These plots show the distribution of the DHS sites surrounding the Transcript Start Site of the nearest gene.
Stats
Number of sites: 149Promoter: 6%
CpG-Island: 0%
Conserved: 49%
Enriched Motifs & Matches
Match Detail: [Jaspar]
|
| ||
|---|---|---|
| Sites: 38/100 | e-val: 0.027 | ||
| Factor | e-val(match) | DB |
| HNF1B | 0.0000015734 | JASPAR |
| Foxd3 | 0.00022952 | JASPAR |
| HNF1A | 0.00037537 | JASPAR |
| Pax4 | 0.0014885 | JASPAR |
| ARID3A | 0.0035598 | JASPAR |
BED file downloads
Top 10 Example Regions
| Location | Gene Link | Dist. |
|---|---|---|
| chr2: 161232480-161232630 | RBMS1 | 58.64 |
| chr5: 66391360-66391510 | MAST4-AS1 | 59.81 |
| chrX: 119597220-119597370 | ATP1B4 | 61.22 |
| chrX: 119597220-119597370 | LAMP2 | 61.22 |
| chr6: 86170940-86171090 | RP11-30P6.6 | 69.55 |
| chr8: 89252260-89252410 | RP11-586K2.1 | 70.69 |
| chr10: 91106300-91106450 | LIPA | 75.4 |
| chr14: 75748920-75749070 | RP11-293M10.4 | 76.32 |
| chr14: 75748920-75749070 | FOS | 76.32 |
| chr21: 31019780-31019930 | GRIK1 | 77.21 |