SOM cluster: 1421
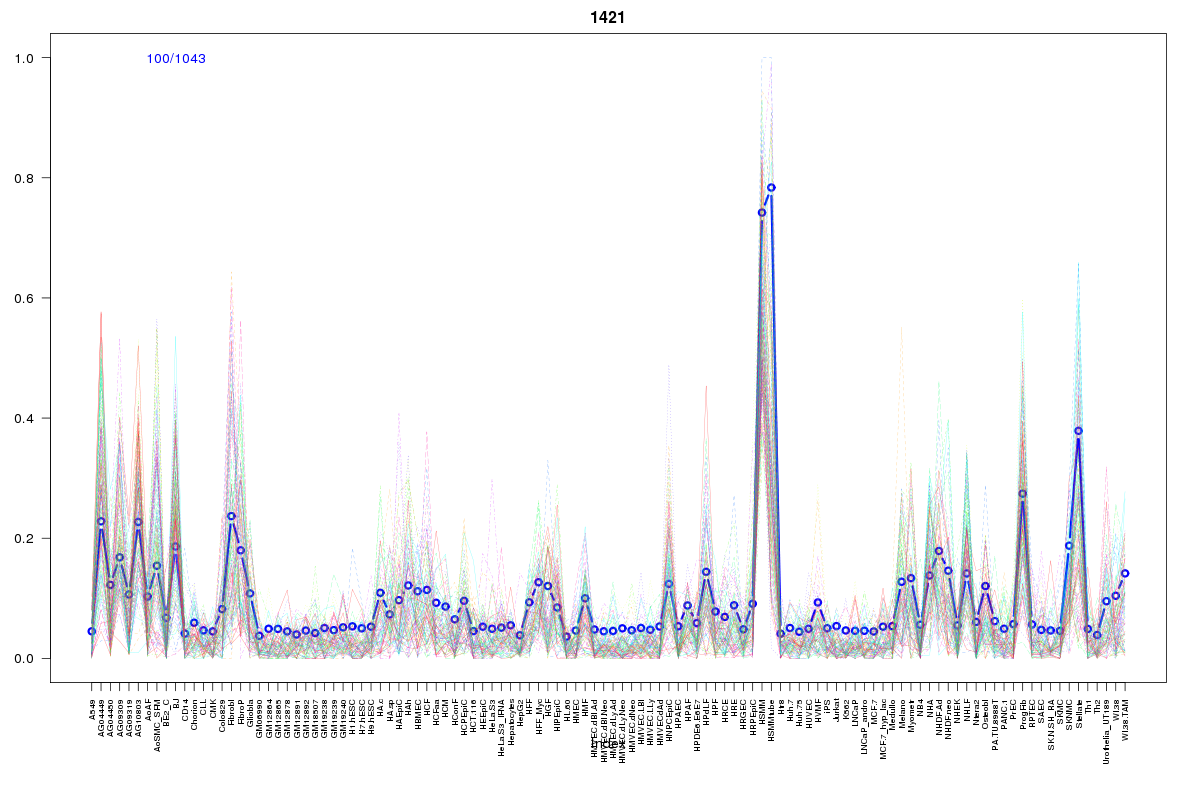
Cluster Hypersensitivity Profile

Genomic Location Trend
These plots show the distribution of the DHS sites surrounding the Transcript Start Site of the nearest gene.
Stats
Number of sites: 1043Promoter: 0%
CpG-Island: 0%
Conserved: 27%
Enriched Motifs & Matches
Match Detail: [Jaspar]
|
| ||
|---|---|---|
| Sites: 28/100 | e-val: 0.0000000064 | ||
| Factor | e-val(match) | DB |
| HNF1B | 0.00072519 | JASPAR |
| ARID3A | 0.0015639 | JASPAR |
| MEF2A | 0.0060912 | JASPAR |
| NKX3-1 | 0.010596 | JASPAR |
| Foxq1 | 0.012408 | JASPAR |
BED file downloads
Top 10 Example Regions
| Location | Gene Link | Dist. |
|---|---|---|
| chr8: 97659520-97659670 | SDC2 | 36.07 |
| chr8: 97659520-97659670 | CPQ | 36.07 |
| chr15: 39959160-39959310 | FSIP1 | 39.82 |
| chr15: 39959160-39959310 | CTD-2033D15.1 | 39.82 |
| chr15: 39959160-39959310 | THBS1 | 39.82 |
| chr17: 76654745-76654895 | DNAH17 | 44.48 |
| chr17: 76654745-76654895 | CYTH1 | 44.48 |
| chr17: 10446860-10447010 | MYH3 | 47.67 |
| chr17: 10446860-10447010 | MYH2 | 47.67 |
| chr9: 113475360-113475510 | MUSK | 47.74 |