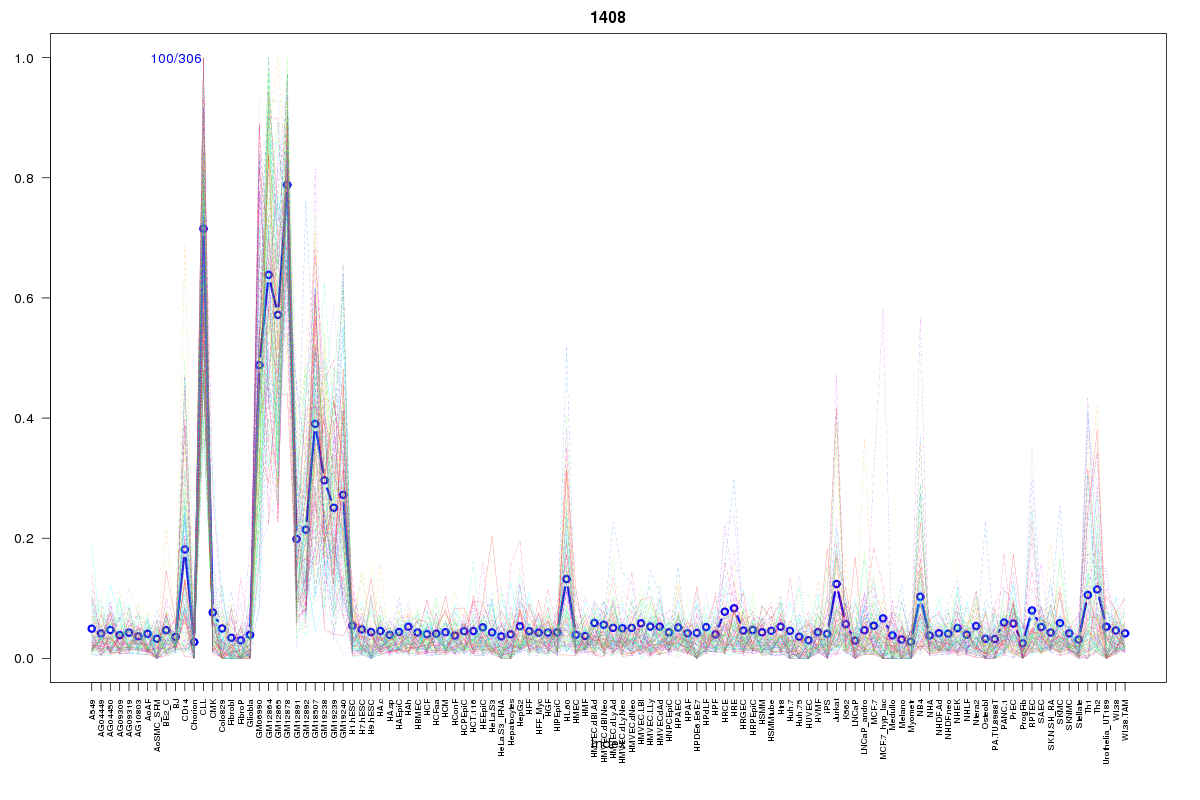
SOM cluster: 1408
Cluster Hypersensitivity Profile

Genomic Location Trend
These plots show the distribution of the DHS sites surrounding the Transcript Start Site of the nearest gene.
Stats
Number of sites: 306Promoter: 7%
CpG-Island: 0%
Conserved: 17%
Enriched Motifs & Matches
Match Detail: [Jaspar]
|
| ||
|---|---|---|
| Sites: 24/100 | e-val: 0.000000000091 | ||
| Factor | e-val(match) | DB |
| IRF1 | 0.0000000000087111 | JASPAR |
| SPI1 | 0.00000022598 | JASPAR |
| IRF2 | 0.00000157 | JASPAR |
| FEV | 0.00036047 | JASPAR |
| SPIB | 0.00057051 | JASPAR |
BED file downloads
Top 10 Example Regions
| Location | Gene Link | Dist. |
|---|---|---|
| chr1: 10233700-10233850 | KIF1B | 38.74 |
| chr3: 25810380-25810530 | NGLY1 | 44.57 |
| chr21: 43894760-43894910 | RSPH1 | 48.85 |
| chr1: 160611340-160611490 | SLAMF7 | 50.91 |
| chr1: 160611340-160611490 | RP11-404F10.2 | 50.91 |
| chr17: 73660485-73660635 | SMIM5 | 51.51 |
| chr17: 73660485-73660635 | RECQL5 | 51.51 |
| chr1: 160444260-160444410 | CD84 | 53.44 |
| chr1: 160444260-160444410 | SLAMF6 | 53.44 |
| chr8: 56784240-56784390 | LYN | 60.18 |