SOM cluster: 1403
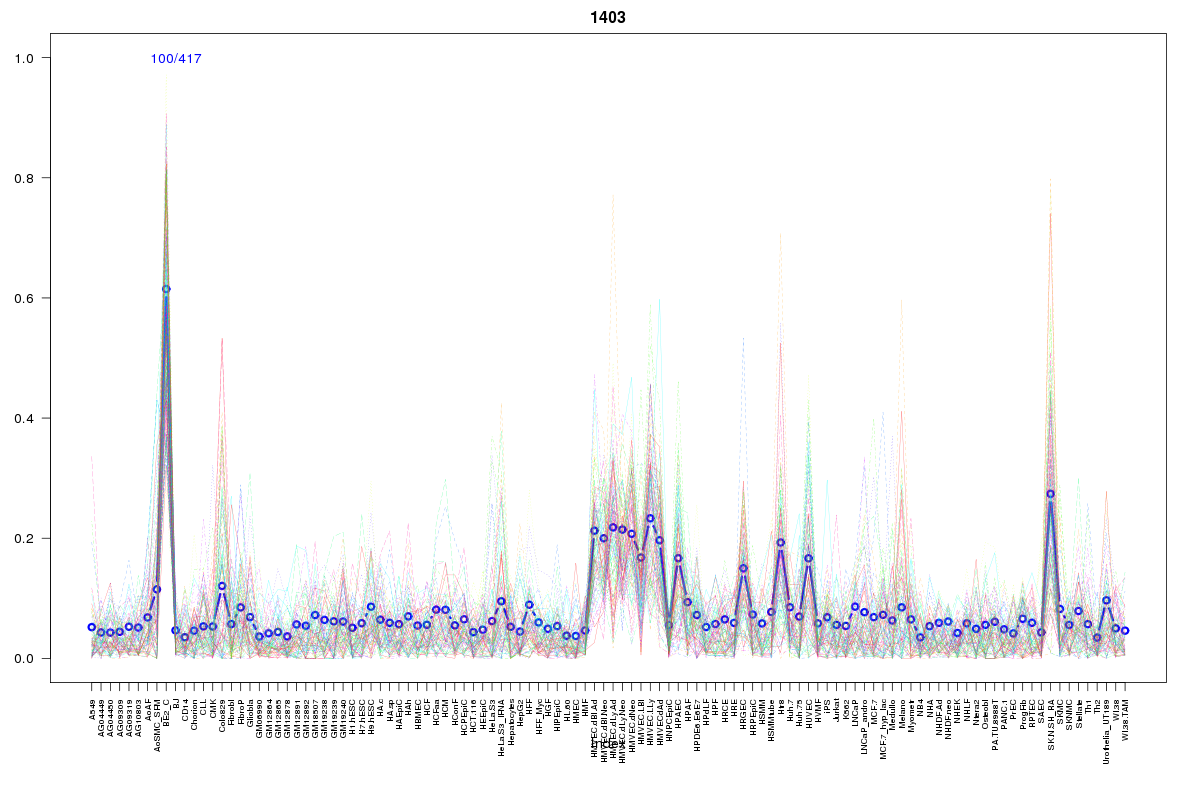
Cluster Hypersensitivity Profile

Genomic Location Trend
These plots show the distribution of the DHS sites surrounding the Transcript Start Site of the nearest gene.
Stats
Number of sites: 417Promoter: 1%
CpG-Island: 0%
Conserved: 38%
Enriched Motifs & Matches
Match Detail: [Jaspar]
|
| ||
|---|---|---|
| Sites: 21/100 | e-val: 0.0000012 | ||
| Factor | e-val(match) | DB |
| TLX1::NFIC | 0.000000000055646 | JASPAR |
| E2F1 | 0.0025538 | JASPAR |
| INSM1 | 0.0027872 | JASPAR |
| NFIC | 0.0029906 | JASPAR |
| HNF4A | 0.0052806 | JASPAR |
BED file downloads
Top 10 Example Regions
| Location | Gene Link | Dist. |
|---|---|---|
| chr17: 27969185-27969335 | ANKRD13B | 50.54 |
| chr17: 27969185-27969335 | GIT1 | 50.54 |
| chr19: 45353900-45354050 | APOE | 56.13 |
| chr4: 41439340-41439490 | RP11-124A7.1 | 56.31 |
| chr4: 41439340-41439490 | LIMCH1 | 56.31 |
| chr3: 129528280-129528430 | AC083799.1 | 56.4 |
| chr3: 129528280-129528430 | TMCC1 | 56.4 |
| chr22: 38368680-38368830 | SOX10 | 58.15 |
| chr12: 79346060-79346210 | SYT1 | 58.3 |
| chr3: 170281740-170281890 | SLC7A14 | 59.89 |