SOM cluster: 1400
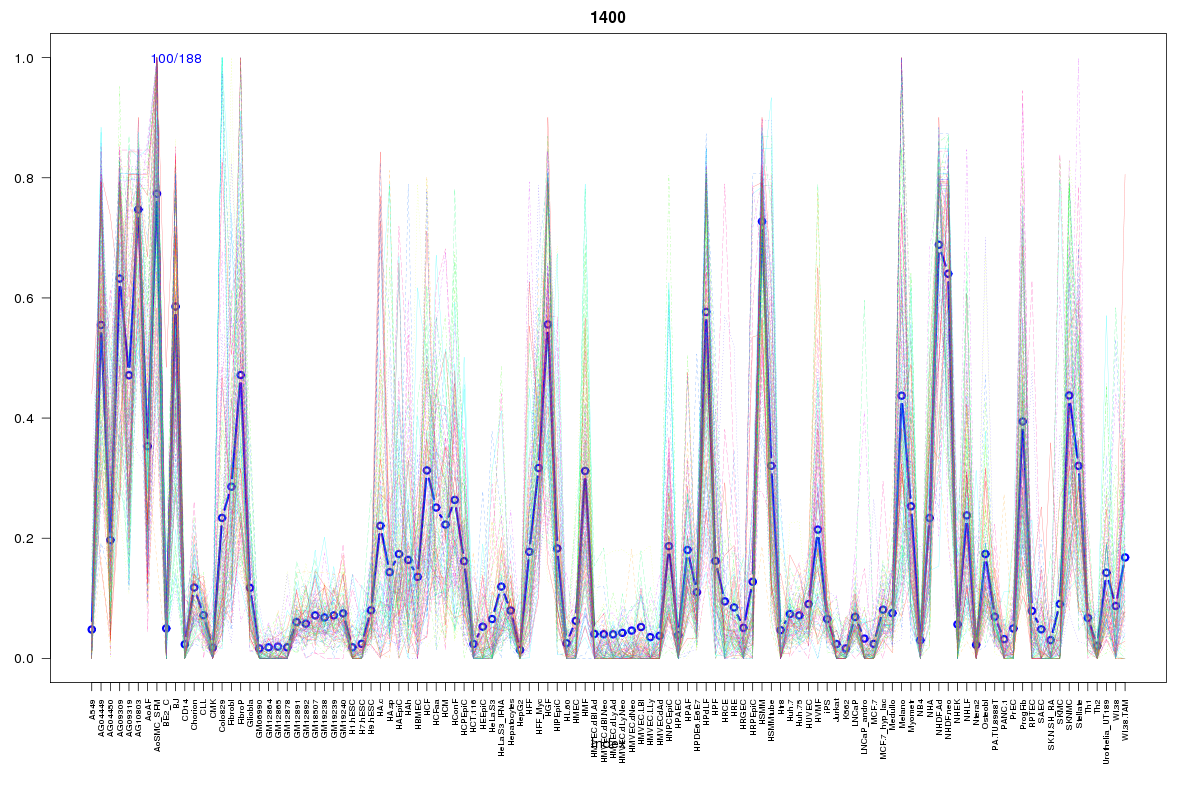
Cluster Hypersensitivity Profile

Genomic Location Trend
These plots show the distribution of the DHS sites surrounding the Transcript Start Site of the nearest gene.
Stats
Number of sites: 188Promoter: 0%
CpG-Island: 0%
Conserved: 57%
Enriched Motifs & Matches
Match Detail: [Jaspar]
|
| ||
|---|---|---|
| Sites: 35/100 | e-val: 0.000000066 | ||
| Factor | e-val(match) | DB |
| TEAD1 | 0.000027611 | JASPAR |
| NR3C1 | 0.0013093 | JASPAR |
| Pax4 | 0.0015122 | JASPAR |
| RELA | 0.0015204 | JASPAR |
| NF-kappaB | 0.0061242 | JASPAR |
|
| ||
| Sites: 24/100 | e-val: 0.014 | ||
| Factor | e-val(match) | DB |
| Foxd3 | 0.00033122 | JASPAR |
| Lhx3 | 0.0005215 | JASPAR |
| Foxq1 | 0.0010105 | JASPAR |
| Pou5f1 | 0.0021301 | JASPAR |
| ARID3A | 0.0032343 | JASPAR |
|
| ||
| Sites: 17/100 | e-val: 1.8 | ||
| Factor | e-val(match) | DB |
| HNF1A | 0.000011674 | JASPAR |
| Pax4 | 0.00053067 | JASPAR |
| NR3C1 | 0.0020176 | JASPAR |
| HNF1B | 0.003164 | JASPAR |
| EWSR1-FLI1 | 0.0087507 | JASPAR |
BED file downloads
Top 10 Example Regions
| Location | Gene Link | Dist. |
|---|---|---|
| chr12: 105469980-105470130 | APPL2 | 37.59 |
| chr12: 105469980-105470130 | ALDH1L2 | 37.59 |
| chr7: 116899800-116899950 | WNT2 | 44.41 |
| chr7: 116899800-116899950 | AC006326.3 | 44.41 |
| chr2: 151444025-151444175 | RND3 | 45.96 |
| chr12: 108765920-108766070 | CMKLR1 | 49.7 |
| chr5: 102192220-102192370 | PAM | 53.62 |
| chr3: 57904160-57904310 | PPIAP16 | 55.4 |
| chr19: 1022800-1022950 | ARID3A | 65.26 |
| chr19: 1022800-1022950 | CNN2 | 65.26 |