SOM cluster: 140
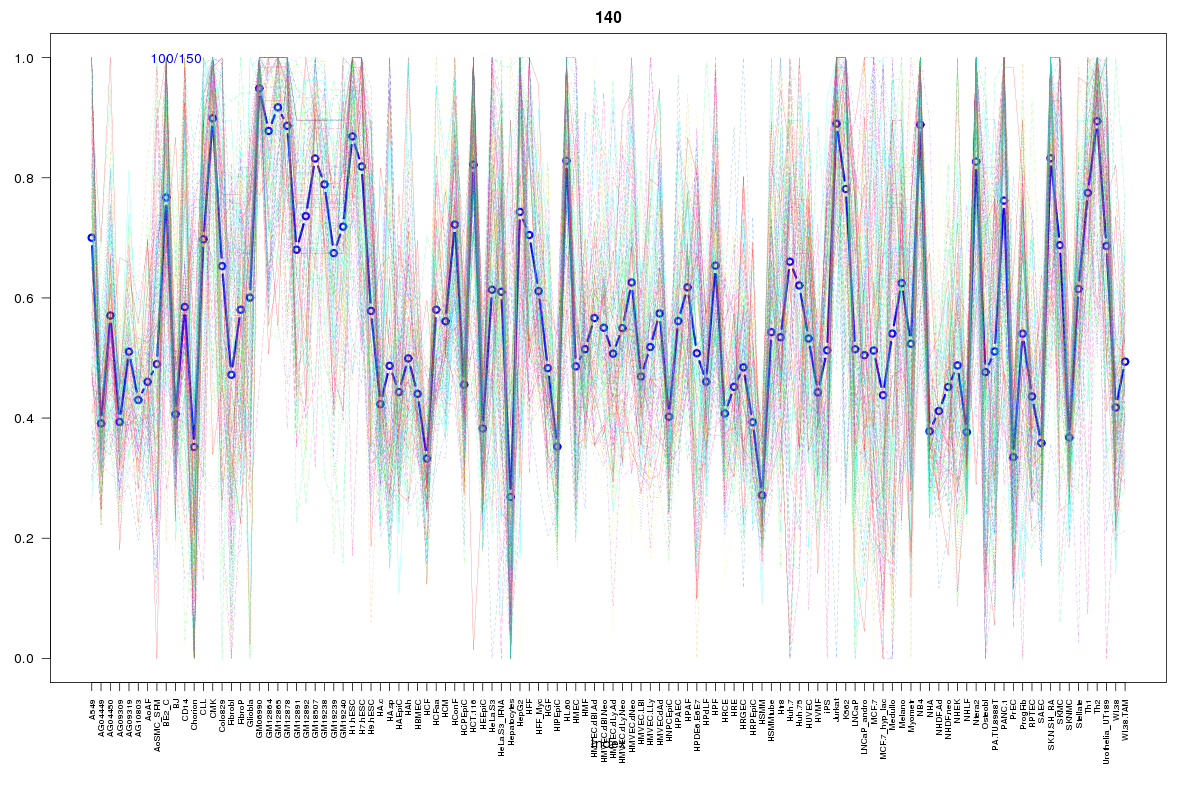
Cluster Hypersensitivity Profile

Genomic Location Trend
These plots show the distribution of the DHS sites surrounding the Transcript Start Site of the nearest gene.
Stats
Number of sites: 150Promoter: 55%
CpG-Island: 60%
Conserved: 66%
Enriched Motifs & Matches
Match Detail: [Jaspar]
|
| ||
|---|---|---|
| Sites: 89/100 | e-val: 1.7e-26 | ||
| Factor | e-val(match) | DB |
| SP1 | 0.00034421 | JASPAR |
| Klf4 | 0.0078062 | JASPAR |
| TFAP2A | 0.016957 | JASPAR |
| Egr1 | 0.029093 | JASPAR |
| Zfx | 0.030524 | JASPAR |
|
| ||
| Sites: 47/100 | e-val: 0.00097 | ||
| Factor | e-val(match) | DB |
| SP1 | 0.000011355 | JASPAR |
| PLAG1 | 0.00082696 | JASPAR |
| SPIB | 0.016635 | JASPAR |
| MZF1_1-4 | 0.020669 | JASPAR |
| E2F1 | 0.022306 | JASPAR |
BED file downloads
Top 10 Example Regions
| Location | Gene Link | Dist. |
|---|---|---|
| chr1: 91966840-91966990 | CDC7 | 6.72 |
| chr1: 92545960-92546110 | EPHX4 | 12.57 |
| chr1: 92545960-92546110 | GAPDHP46 | 12.57 |
| chr1: 92545960-92546110 | BRDT | 12.57 |
| chr1: 150206940-150207090 | PRPF3 | 12.95 |
| chr1: 150206940-150207090 | C1orf54 | 12.95 |
| chr1: 150206940-150207090 | ANP32E | 12.95 |
| chr1: 150206940-150207090 | C1orf51 | 12.95 |
| chr6: 28303660-28303810 | ZKSCAN4 | 26.36 |
| chr6: 28303660-28303810 | RP5-874C20.3 | 26.36 |