SOM cluster: 1398
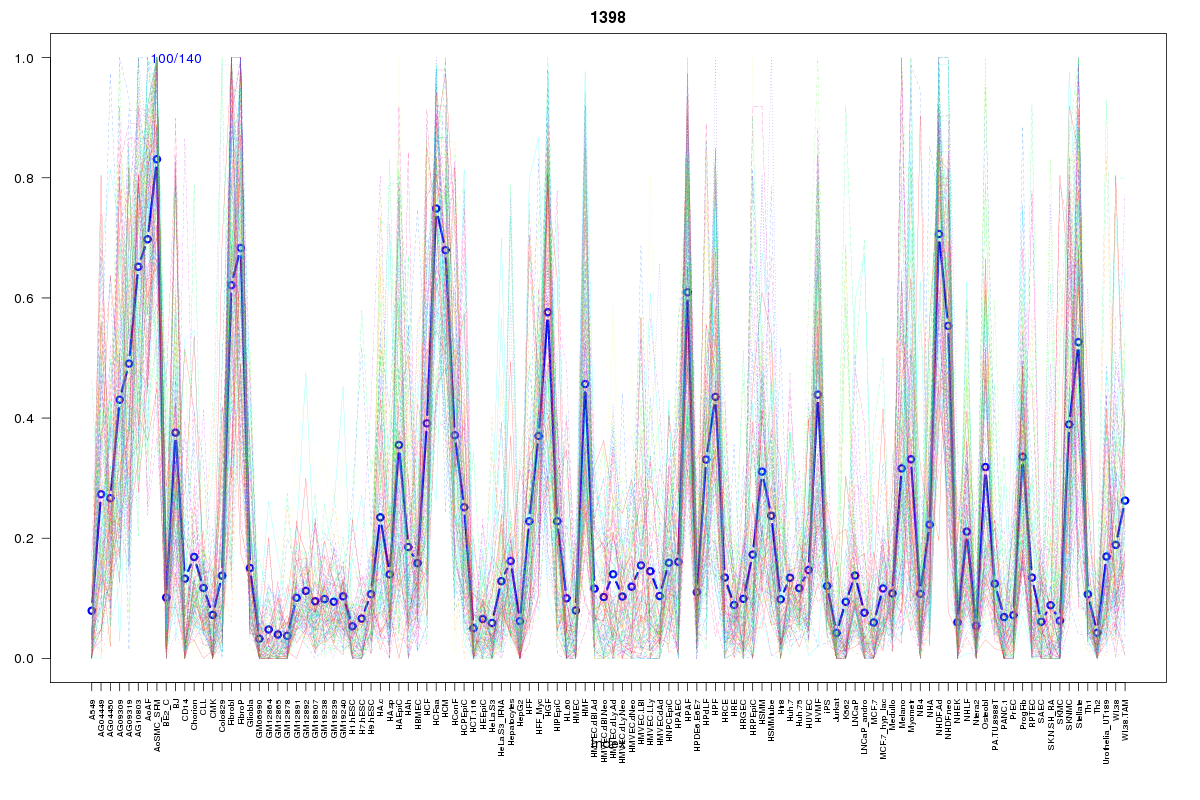
Cluster Hypersensitivity Profile

Genomic Location Trend
These plots show the distribution of the DHS sites surrounding the Transcript Start Site of the nearest gene.
Stats
Number of sites: 140Promoter: 3%
CpG-Island: 0%
Conserved: 43%
Enriched Motifs & Matches
Match Detail: [Jaspar]
|
| ||
|---|---|---|
| Sites: 19/100 | e-val: 0.00013 | ||
| Factor | e-val(match) | DB |
| EWSR1-FLI1 | 0.000032251 | JASPAR |
| SP1 | 0.0011962 | JASPAR |
| Spz1 | 0.0045243 | JASPAR |
| IRF2 | 0.0068426 | JASPAR |
| NFKB1 | 0.016168 | JASPAR |
BED file downloads
Top 10 Example Regions
| Location | Gene Link | Dist. |
|---|---|---|
| chr1: 183174740-183174890 | LAMC1 | 34.82 |
| chr1: 183174740-183174890 | RP11-548N1.1 | 34.82 |
| chr4: 88939760-88939910 | ABCG2 | 45.6 |
| chr4: 88939760-88939910 | PKD2 | 45.6 |
| chr17: 48110780-48110930 | RP11-1094H24.4 | 53.62 |
| chr17: 48110780-48110930 | PDK2 | 53.62 |
| chr5: 1568920-1569070 | LPCAT1 | 57.67 |
| chr8: 99371020-99371170 | NIPAL2 | 62.89 |
| chr8: 99371020-99371170 | KCNS2 | 62.89 |
| chr17: 65285885-65286035 | PSMD12 | 63.46 |