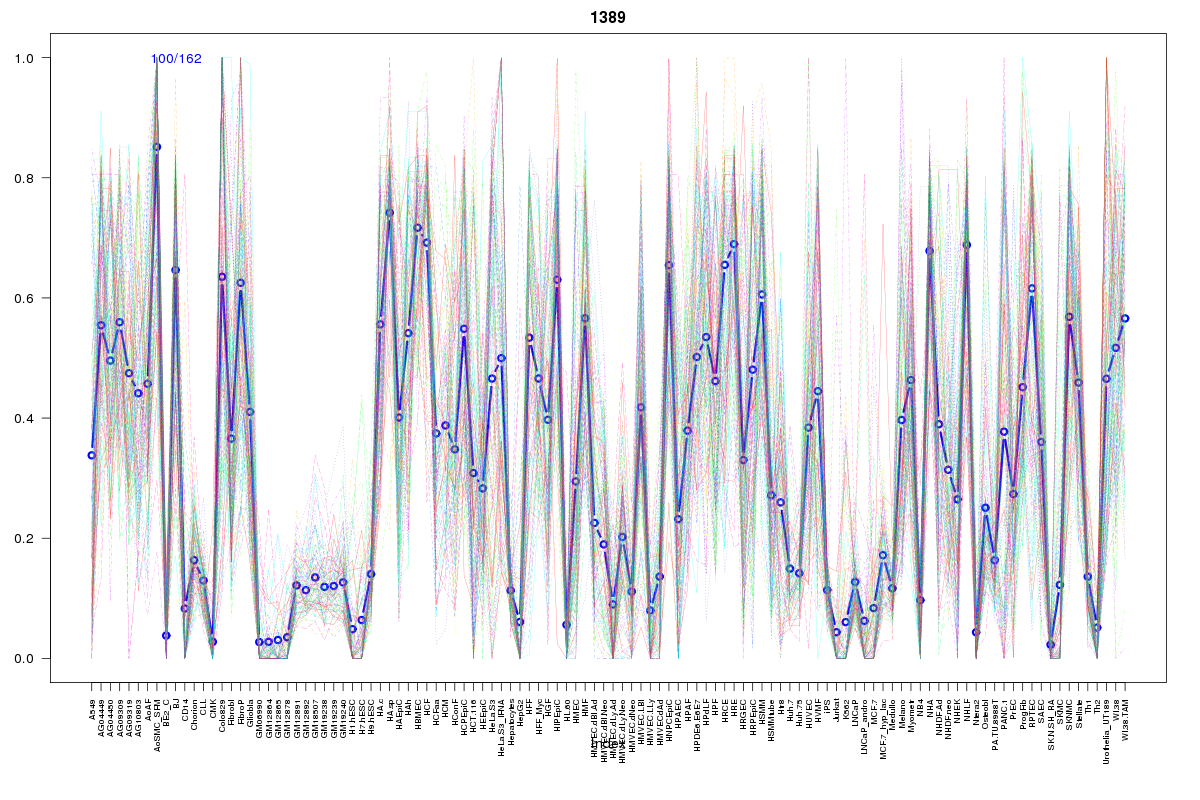
SOM cluster: 1389
Cluster Hypersensitivity Profile

Genomic Location Trend
These plots show the distribution of the DHS sites surrounding the Transcript Start Site of the nearest gene.
Stats
Number of sites: 162Promoter: 1%
CpG-Island: 0%
Conserved: 53%
Enriched Motifs & Matches
Match Detail: [Jaspar]
|
| ||
|---|---|---|
| Sites: 47/100 | e-val: 4.6e-23 | ||
| Factor | e-val(match) | DB |
| NFE2L2 | 0.0000000034197 | JASPAR |
| AP1 | 0.0000000058927 | JASPAR |
| Pax2 | 0.0053589 | JASPAR |
| NFE2L1::MafG | 0.008252 | JASPAR |
| PPARG | 0.020052 | JASPAR |
|
| ||
| Sites: 33/100 | e-val: 0.000000077 | ||
| Factor | e-val(match) | DB |
| Lhx3 | 0.000091385 | JASPAR |
| ARID3A | 0.00016533 | JASPAR |
| Foxd3 | 0.001072 | JASPAR |
| Foxq1 | 0.0018278 | JASPAR |
| Prrx2 | 0.0046383 | JASPAR |
BED file downloads
Top 10 Example Regions
| Location | Gene Link | Dist. |
|---|---|---|
| chr8: 77318360-77318510 | LINC01111 | 41.37 |
| chr1: 57176420-57176570 | PRKAA2 | 45.91 |
| chr1: 28763940-28764090 | RCC1 | 50.08 |
| chr1: 28763940-28764090 | snoU13 | 50.08 |
| chr5: 39756005-39756155 | INTS6P1 | 57.15 |
| chr13: 43728020-43728170 | DNAJC15 | 60.02 |
| chrX: 3181000-3181150 | MXRA5 | 61.09 |
| chr1: 52110340-52110490 | RP11-191G24.1 | 61.81 |
| chr6: 16640000-16640150 | ATXN1 | 62.78 |
| chr2: 143841380-143841530 | ARHGAP15 | 63.53 |