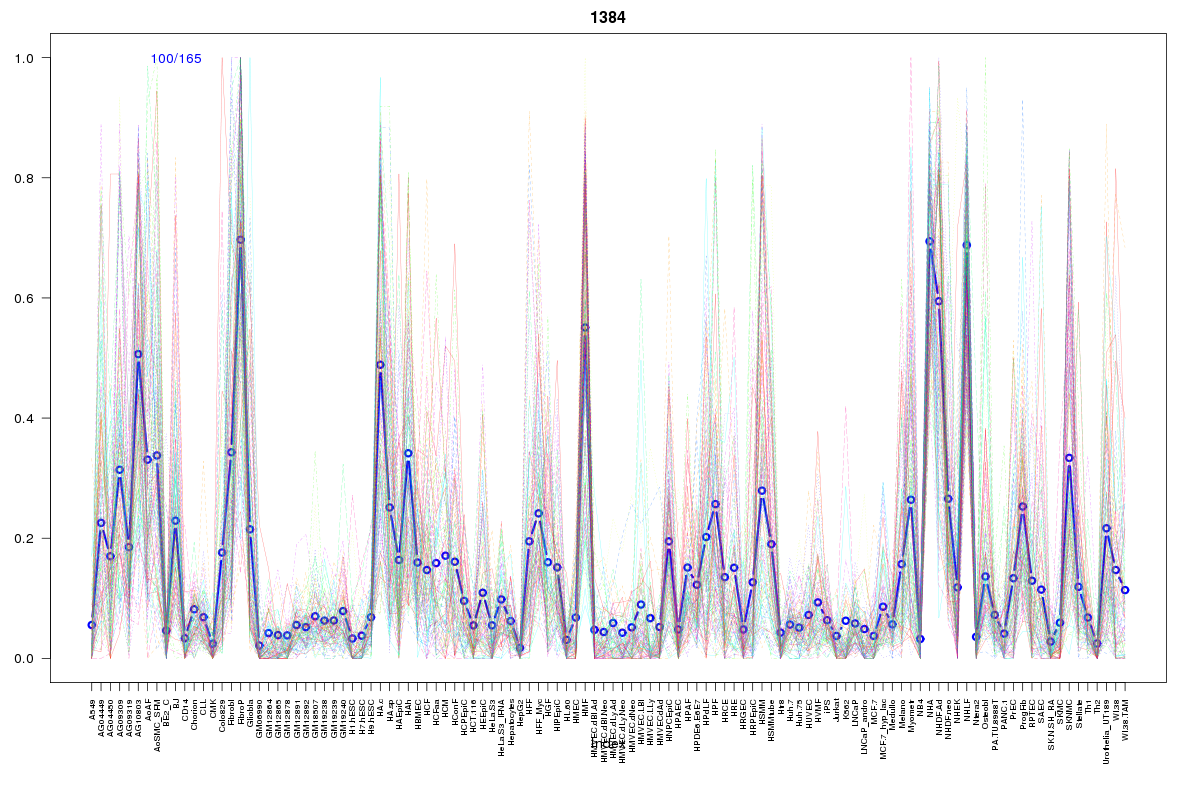
SOM cluster: 1384
Cluster Hypersensitivity Profile

Genomic Location Trend
These plots show the distribution of the DHS sites surrounding the Transcript Start Site of the nearest gene.
Stats
Number of sites: 165Promoter: 0%
CpG-Island: 0%
Conserved: 44%
Enriched Motifs & Matches
Match Detail: [Jaspar]
|
| ||
|---|---|---|
| Sites: 47/100 | e-val: 8.3e-18 | ||
| Factor | e-val(match) | DB |
| AP1 | 0.0000000073276 | JASPAR |
| NFE2L2 | 0.0000029231 | JASPAR |
| PBX1 | 0.0011446 | JASPAR |
| PPARG | 0.0012192 | JASPAR |
| NFE2L1::MafG | 0.018175 | JASPAR |
BED file downloads
Top 10 Example Regions
| Location | Gene Link | Dist. |
|---|---|---|
| chr15: 101806340-101806490 | PCSK6 | 51.69 |
| chr1: 13926700-13926850 | PDPN | 58.92 |
| chr9: 78722500-78722650 | PCSK5 | 61.76 |
| chr2: 69264200-69264350 | ANTXR1 | 64.51 |
| chr9: 18478640-18478790 | ADAMTSL1 | 66.78 |
| chr1: 34432480-34432630 | CSMD2 | 67.99 |
| chr17: 61446720-61446870 | TANC2 | 72.37 |
| chr2: 119508660-119508810 | EN1 | 75.75 |
| chr20: 51780160-51780310 | TSHZ2 | 76.98 |
| chr2: 8989580-8989730 | MBOAT2 | 78.93 |