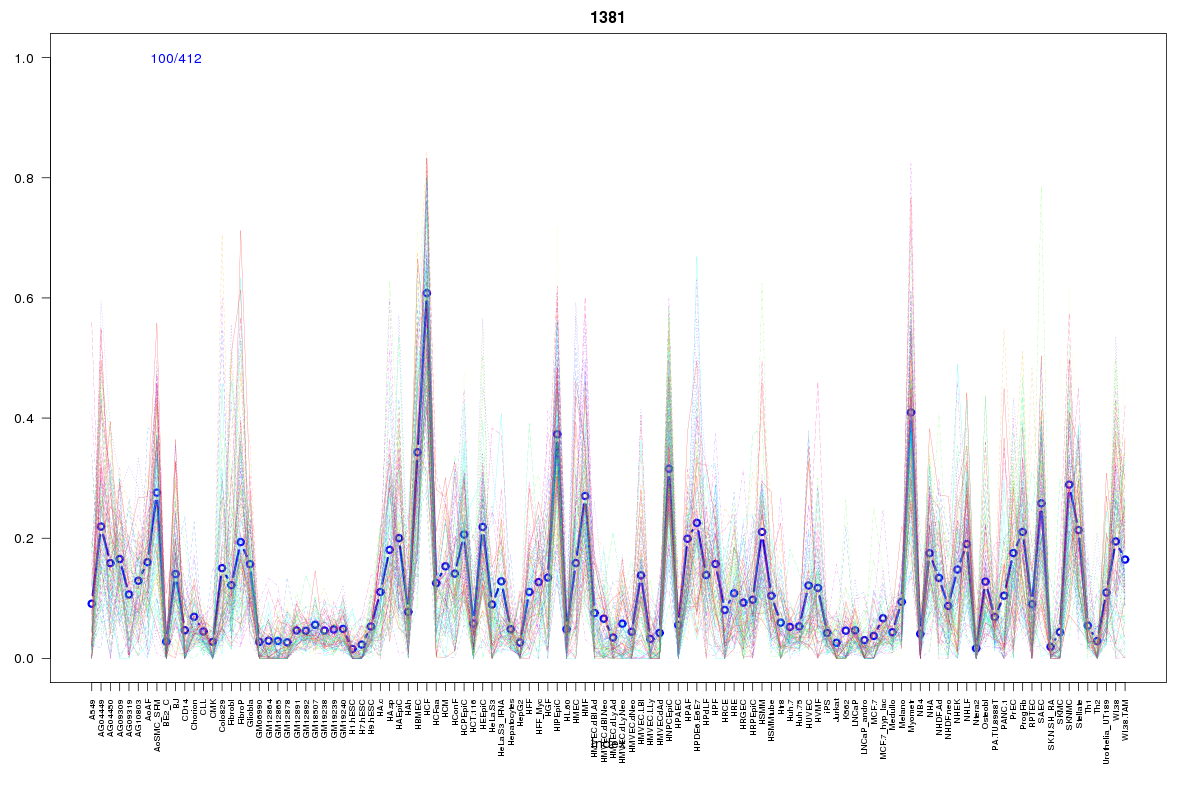
SOM cluster: 1381
Cluster Hypersensitivity Profile

Genomic Location Trend
These plots show the distribution of the DHS sites surrounding the Transcript Start Site of the nearest gene.
Stats
Number of sites: 412Promoter: 1%
CpG-Island: 0%
Conserved: 15%
Enriched Motifs & Matches
Match Detail: [Jaspar]
|
| ||
|---|---|---|
| Sites: 56/100 | e-val: 2.4e-21 | ||
| Factor | e-val(match) | DB |
| AP1 | 0.000000073481 | JASPAR |
| NFE2L2 | 0.001146 | JASPAR |
| Prrx2 | 0.018822 | JASPAR |
| Pdx1 | 0.024649 | JASPAR |
| NFE2L1::MafG | 0.080301 | JASPAR |
BED file downloads
Top 10 Example Regions
| Location | Gene Link | Dist. |
|---|---|---|
| chr2: 122259745-122259895 | CLASP1 | 26.81 |
| chr9: 117449420-117449570 | C9orf91 | 30.8 |
| chr4: 145499980-145500130 | HHIP | 55.29 |
| chr1: 184941460-184941610 | FAM129A | 60.73 |
| chr1: 184941460-184941610 | FTH1P25 | 60.73 |
| chr3: 196005420-196005570 | PCYT1A | 61.88 |
| chr7: 112363500-112363650 | TMEM168 | 62.58 |
| chr7: 112363500-112363650 | C7orf60 | 62.58 |
| chr5: 115282500-115282650 | AP3S1 | 63.93 |
| chr11: 110068880-110069030 | ZC3H12C | 64.93 |