SOM cluster: 1375
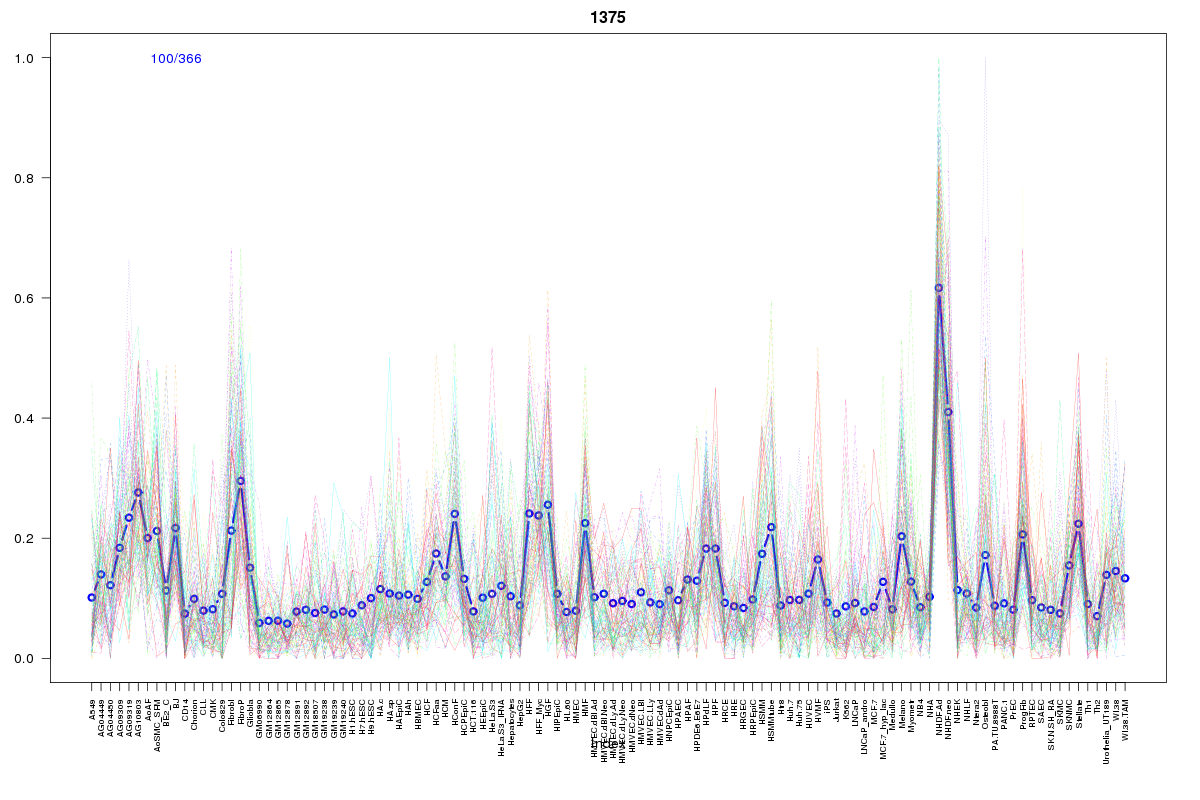
Cluster Hypersensitivity Profile

Genomic Location Trend
These plots show the distribution of the DHS sites surrounding the Transcript Start Site of the nearest gene.
Stats
Number of sites: 366Promoter: 7%
CpG-Island: 0%
Conserved: 33%
Enriched Motifs & Matches
Match Detail: [Jaspar]
|
| ||
|---|---|---|
| Sites: 26/100 | e-val: 0.000002 | ||
| Factor | e-val(match) | DB |
| SP1 | 0.000085261 | JASPAR |
| EWSR1-FLI1 | 0.0028841 | JASPAR |
| Pax4 | 0.0030313 | JASPAR |
| Klf4 | 0.0053125 | JASPAR |
| PPARG::RXRA | 0.015039 | JASPAR |
BED file downloads
Top 10 Example Regions
| Location | Gene Link | Dist. |
|---|---|---|
| chr9: 132524145-132524295 | UBE2V1P4 | 38.39 |
| chr11: 102138865-102139015 | RP11-864G5.3 | 46.31 |
| chr6: 32050565-32050715 | PRRT1 | 46.93 |
| chr6: 32050565-32050715 | TNXB | 46.93 |
| chr11: 64063840-64063990 | FERMT3 | 51.43 |
| chr11: 64063840-64063990 | PPP1R14B | 51.43 |
| chr11: 64063840-64063990 | RP11-783K16.5 | 51.43 |
| chr8: 124171325-124171475 | ZHX1 | 54.84 |
| chr8: 124171325-124171475 | HMGB1P19 | 54.84 |
| chr17: 40573500-40573650 | PTRF | 56.83 |