SOM cluster: 1360
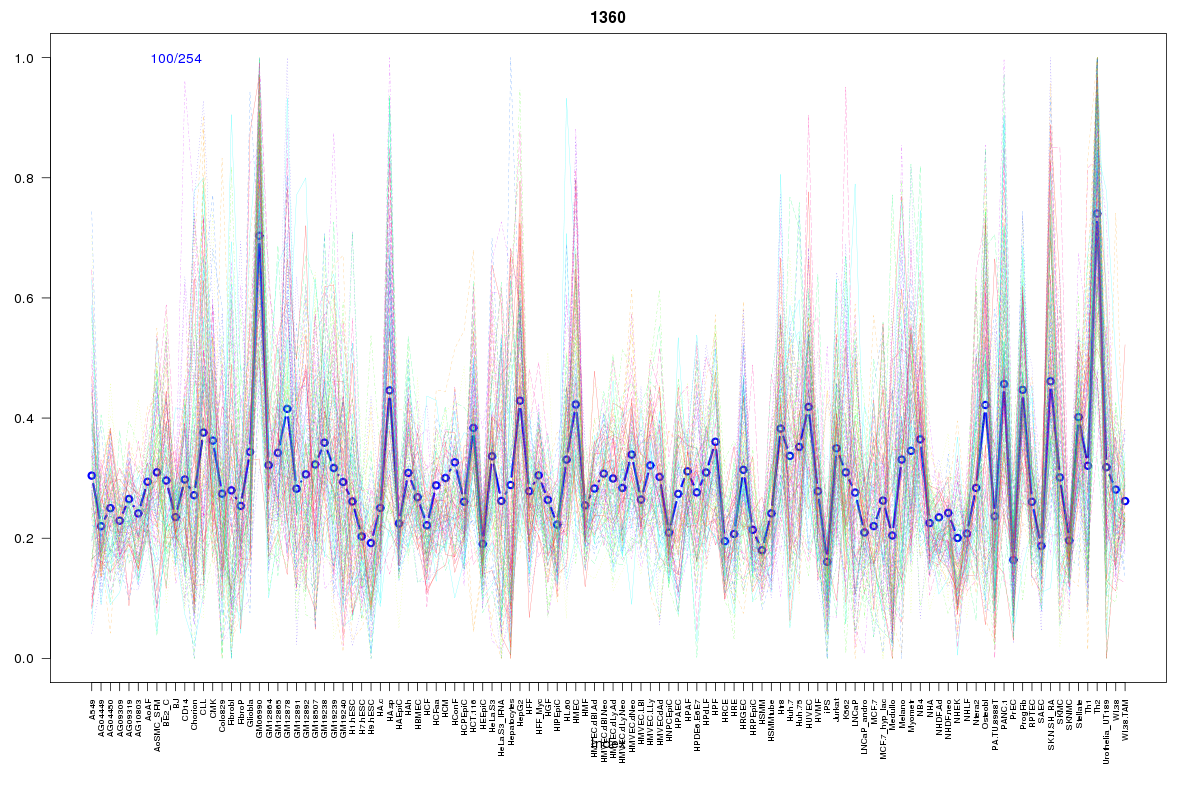
Cluster Hypersensitivity Profile

Genomic Location Trend
These plots show the distribution of the DHS sites surrounding the Transcript Start Site of the nearest gene.
Stats
Number of sites: 254Promoter: 57%
CpG-Island: 59%
Conserved: 27%
Enriched Motifs & Matches
Match Detail: [Jaspar]
|
| ||
|---|---|---|
| Sites: 52/100 | e-val: 0.17 | ||
| Factor | e-val(match) | DB |
| SP1 | 0.00023158 | JASPAR |
| TFAP2A | 0.0080448 | JASPAR |
| Egr1 | 0.022684 | JASPAR |
| Zfx | 0.024438 | JASPAR |
| PLAG1 | 0.035303 | JASPAR |
BED file downloads
Top 10 Example Regions
| Location | Gene Link | Dist. |
|---|---|---|
| chr11: 63580505-63580655 | C11orf84 | 43.52 |
| chr12: 76425000-76425150 | RN7SL734P | 50.09 |
| chr9: 130332345-130332495 | LRSAM1 | 52.95 |
| chr1: 17240920-17241070 | RP1-37C10.3 | 62.41 |
| chr1: 17240920-17241070 | RP11-108M9.4 | 62.41 |
| chr9: 131133240-131133390 | ODF2 | 64.62 |
| chr9: 131133240-131133390 | COQ4 | 64.62 |
| chr2: 70351480-70351630 | PCBP1 | 64.93 |
| chr19: 2474900-2475050 | GADD45B | 65.23 |
| chr19: 2474900-2475050 | TCEB1P28 | 65.23 |