SOM cluster: 1359
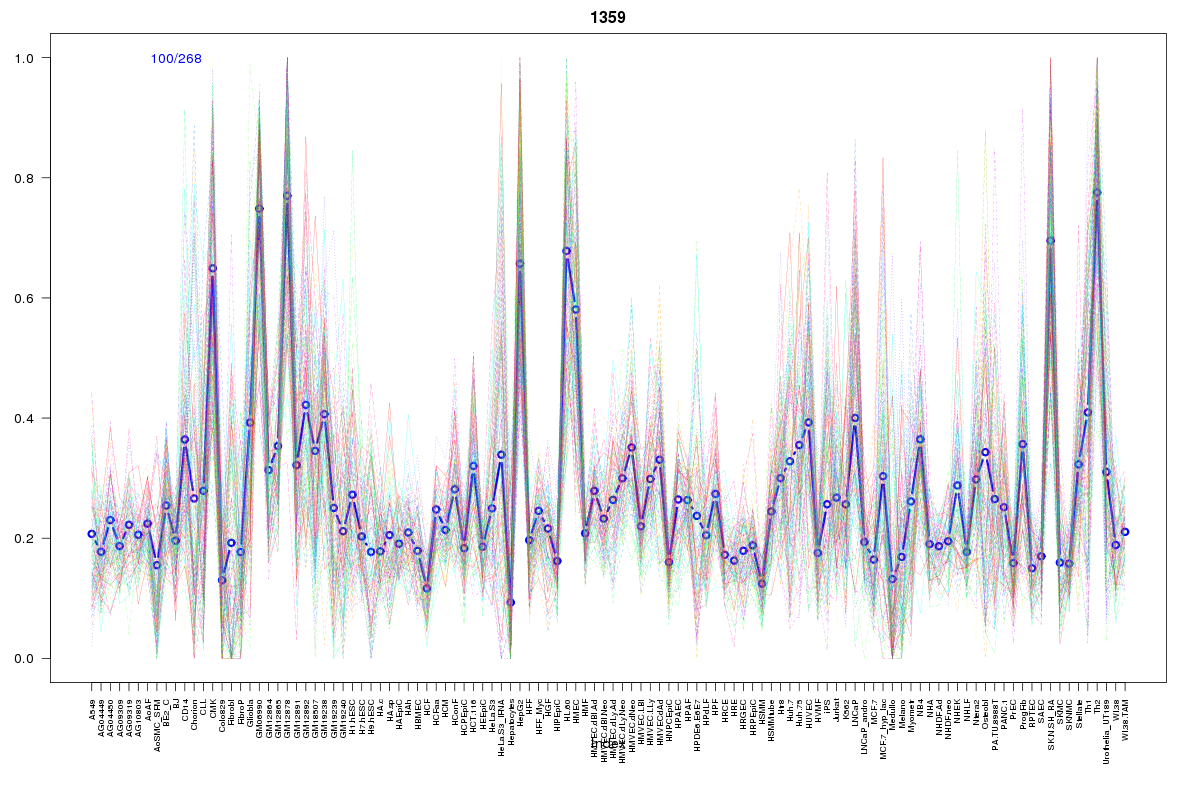
Cluster Hypersensitivity Profile

Genomic Location Trend
These plots show the distribution of the DHS sites surrounding the Transcript Start Site of the nearest gene.
Stats
Number of sites: 268Promoter: 33%
CpG-Island: 94%
Conserved: 69%
Enriched Motifs & Matches
Match Detail: [Jaspar]
|
| ||
|---|---|---|
| Sites: 95/100 | e-val: 0 | ||
| Factor | e-val(match) | DB |
| SP1 | 0.0000028784 | JASPAR |
| TFAP2A | 0.000034338 | JASPAR |
| Egr1 | 0.013447 | JASPAR |
| PLAG1 | 0.043503 | JASPAR |
| INSM1 | 0.13784 | JASPAR |
|
| ||
| Sites: 98/100 | e-val: 5.2e-30 | ||
| Factor | e-val(match) | DB |
| SP1 | 0.0000002883 | JASPAR |
| TFAP2A | 0.000029897 | JASPAR |
| Klf4 | 0.0011426 | JASPAR |
| PLAG1 | 0.014428 | JASPAR |
| Egr1 | 0.027008 | JASPAR |
|
| ||
| Sites: 76/100 | e-val: 0.000043 | ||
| Factor | e-val(match) | DB |
| SP1 | 0.0010402 | JASPAR |
| TEAD1 | 0.0065113 | JASPAR |
| TFAP2A | 0.01081 | JASPAR |
| EWSR1-FLI1 | 0.040829 | JASPAR |
| SPI1 | 0.045568 | JASPAR |
BED file downloads
Top 10 Example Regions
| Location | Gene Link | Dist. |
|---|---|---|
| chr1: 161696380-161696530 | DUSP12 | 41.67 |
| chr1: 26798405-26798555 | HMGN2 | 50.75 |
| chr22: 21996740-21996890 | RIMBP3C | 57.92 |
| chr22: 21996740-21996890 | RN7SKP221 | 57.92 |
| chr16: 70414860-70415010 | DDX19A | 58.68 |
| chr16: 70414860-70415010 | DDX19B | 58.68 |
| chr9: 123638260-123638410 | FBXW2 | 60.39 |
| chr9: 123638260-123638410 | PHF19 | 60.39 |
| chr9: 123638260-123638410 | RP11-27I1.4 | 60.39 |
| chr9: 123638260-123638410 | PSMD5-AS1 | 60.39 |