SOM cluster: 1343
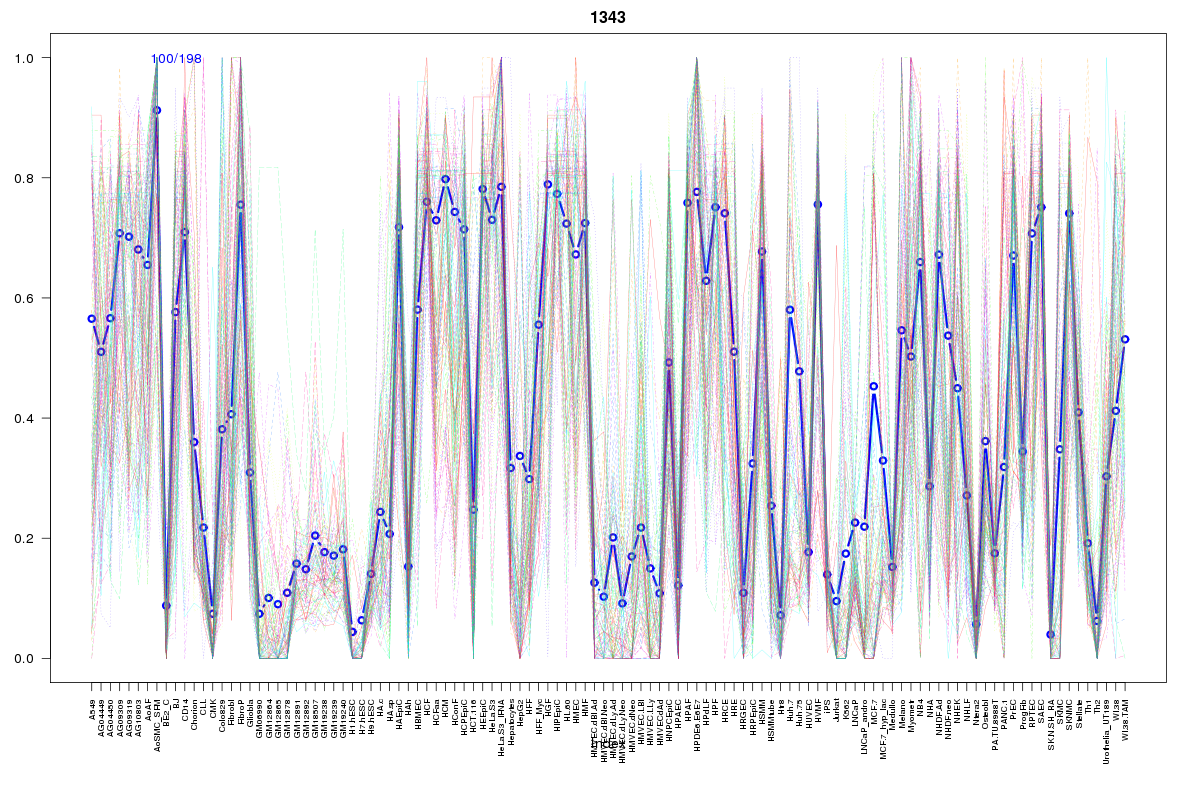
Cluster Hypersensitivity Profile

Genomic Location Trend
These plots show the distribution of the DHS sites surrounding the Transcript Start Site of the nearest gene.
Stats
Number of sites: 198Promoter: 5%
CpG-Island: 0%
Conserved: 47%
Enriched Motifs & Matches
Match Detail: [Jaspar]
|
| ||
|---|---|---|
| Sites: 49/100 | e-val: 2.9e-19 | ||
| Factor | e-val(match) | DB |
| AP1 | 0.000000000019826 | JASPAR |
| NFE2L2 | 0.0000000056885 | JASPAR |
| PPARG | 0.0036546 | JASPAR |
| NFE2L1::MafG | 0.0054756 | JASPAR |
| Foxa2 | 0.012349 | JASPAR |
|
| ||
| Sites: 53/100 | e-val: 8.2e-19 | ||
| Factor | e-val(match) | DB |
| CEBPA | 0.0000000021936 | JASPAR |
| HLF | 0.00032617 | JASPAR |
| Ddit3::Cebpa | 0.00092089 | JASPAR |
| NFIL3 | 0.0033682 | JASPAR |
| NFATC2 | 0.0073751 | JASPAR |
BED file downloads
Top 10 Example Regions
| Location | Gene Link | Dist. |
|---|---|---|
| chr17: 56612320-56612470 | MTMR4 | 45.13 |
| chr17: 56612320-56612470 | HSF5 | 45.13 |
| chr9: 132536020-132536170 | AL590369.1 | 48.61 |
| chr9: 132536020-132536170 | PTGES | 48.61 |
| chr12: 6441740-6441890 | TNFRSF1A | 57.76 |
| chr12: 6441740-6441890 | LTBR | 57.76 |
| chr6: 35694240-35694390 | FKBP5 | 59.15 |
| chr12: 93638060-93638210 | snoU13 | 60.03 |
| chr8: 134143180-134143330 | WISP1 | 61.74 |
| chr14: 31698885-31699035 | RP11-596D21.1 | 61.78 |