SOM cluster: 1339
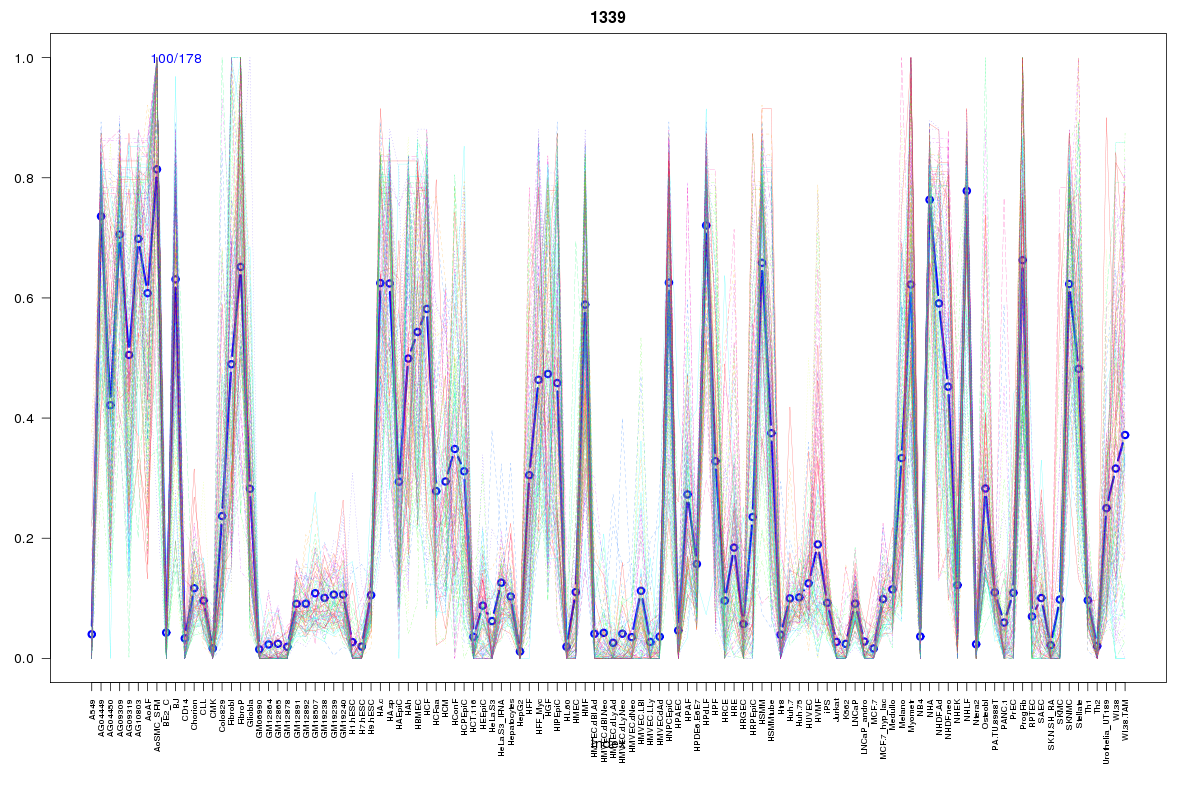
Cluster Hypersensitivity Profile

Genomic Location Trend
These plots show the distribution of the DHS sites surrounding the Transcript Start Site of the nearest gene.
Stats
Number of sites: 178Promoter: 0%
CpG-Island: 0%
Conserved: 53%
Enriched Motifs & Matches
Match Detail: [Jaspar]
|
| ||
|---|---|---|
| Sites: 29/100 | e-val: 1.5 | ||
| Factor | e-val(match) | DB |
| Foxd3 | 0.000053747 | JASPAR |
| Foxq1 | 0.00090507 | JASPAR |
| FOXI1 | 0.00206 | JASPAR |
| HNF1B | 0.003833 | JASPAR |
| MEF2A | 0.0050156 | JASPAR |
|
| ||
| Sites: 34/100 | e-val: 0.0000000023 | ||
| Factor | e-val(match) | DB |
| AP1 | 0.000000000018647 | JASPAR |
| NFE2L2 | 0.000000081709 | JASPAR |
| PBX1 | 0.0015585 | JASPAR |
| PPARG | 0.0067927 | JASPAR |
| Gfi | 0.015374 | JASPAR |