SOM cluster: 1336
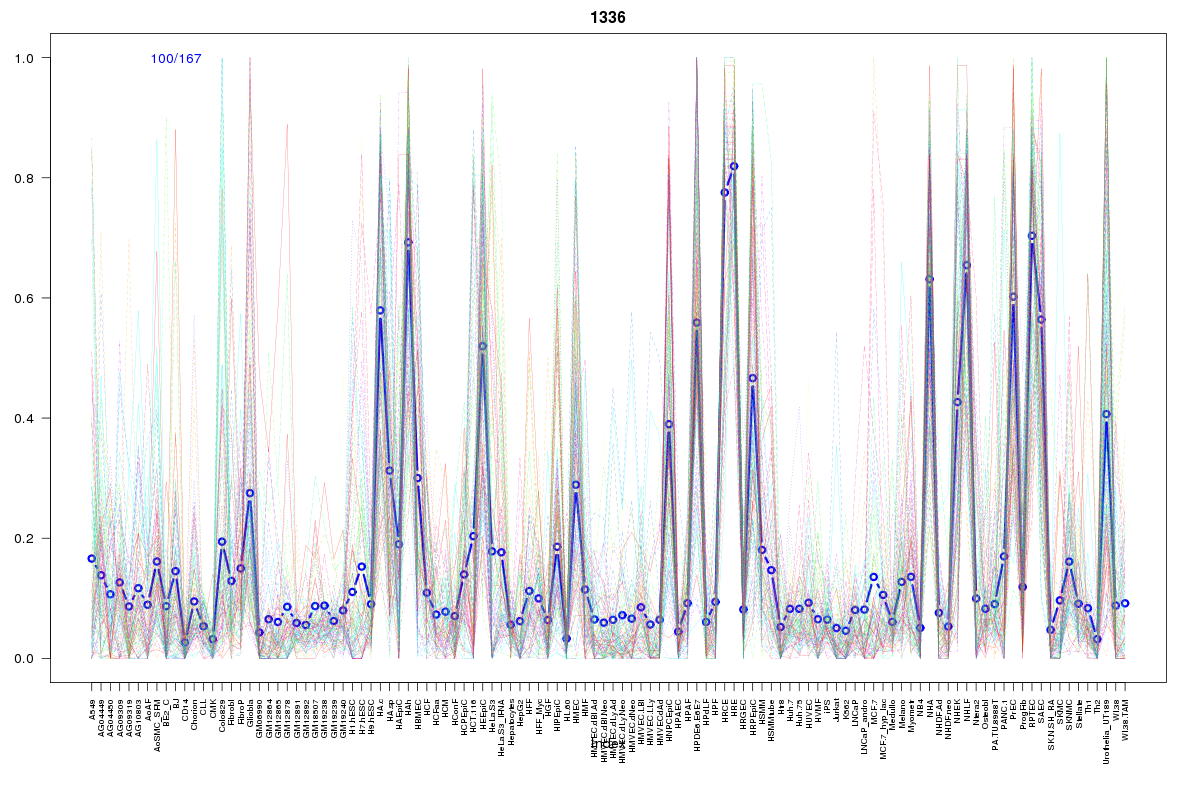
Cluster Hypersensitivity Profile

Genomic Location Trend
These plots show the distribution of the DHS sites surrounding the Transcript Start Site of the nearest gene.
Stats
Number of sites: 167Promoter: 0%
CpG-Island: 0%
Conserved: 44%
Enriched Motifs & Matches
Match Detail: [Jaspar]
|
| ||
|---|---|---|
| Sites: 32/100 | e-val: 0.00000014 | ||
| Factor | e-val(match) | DB |
| AP1 | 0.0000000022645 | JASPAR |
| NFE2L2 | 0.0000000030363 | JASPAR |
| NFE2L1::MafG | 0.000080111 | JASPAR |
| PBX1 | 0.01168 | JASPAR |
| Pax2 | 0.012698 | JASPAR |
BED file downloads
Top 10 Example Regions
| Location | Gene Link | Dist. |
|---|---|---|
| chr12: 76499440-76499590 | PHLDA1 | 33.32 |
| chr7: 144081800-144081950 | ARHGEF5 | 38.27 |
| chr3: 139942620-139942770 | CLSTN2 | 50.75 |
| chr7: 116039860-116040010 | CAV2 | 51.25 |
| chr1: 203121540-203121690 | ADORA1 | 51.51 |
| chr11: 35257600-35257750 | RP1-68D18.2 | 52.6 |
| chr11: 35257600-35257750 | CD44 | 52.6 |
| chr6: 18488880-18489030 | RNF144B | 61.21 |
| chr8: 107512120-107512270 | OXR1 | 63.66 |
| chr18: 30315920-30316070 | KLHL14 | 67.78 |