SOM cluster: 1331
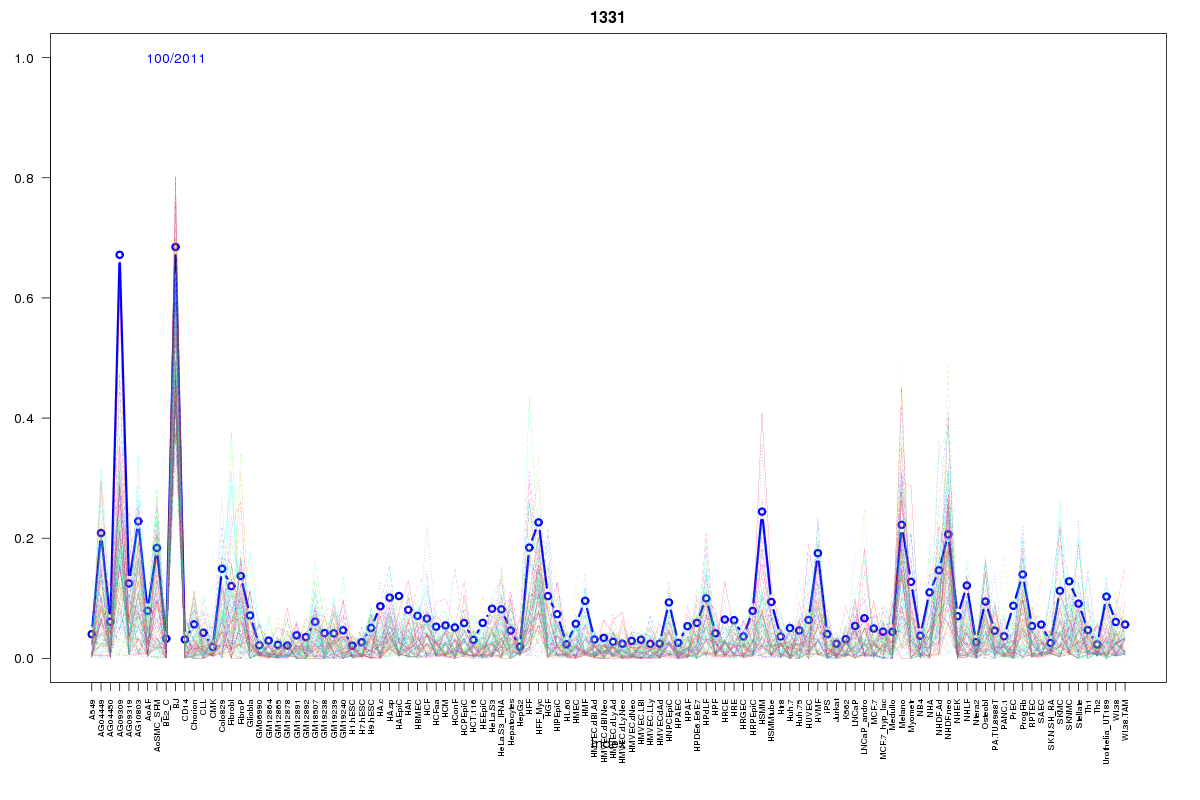
Cluster Hypersensitivity Profile

Genomic Location Trend
These plots show the distribution of the DHS sites surrounding the Transcript Start Site of the nearest gene.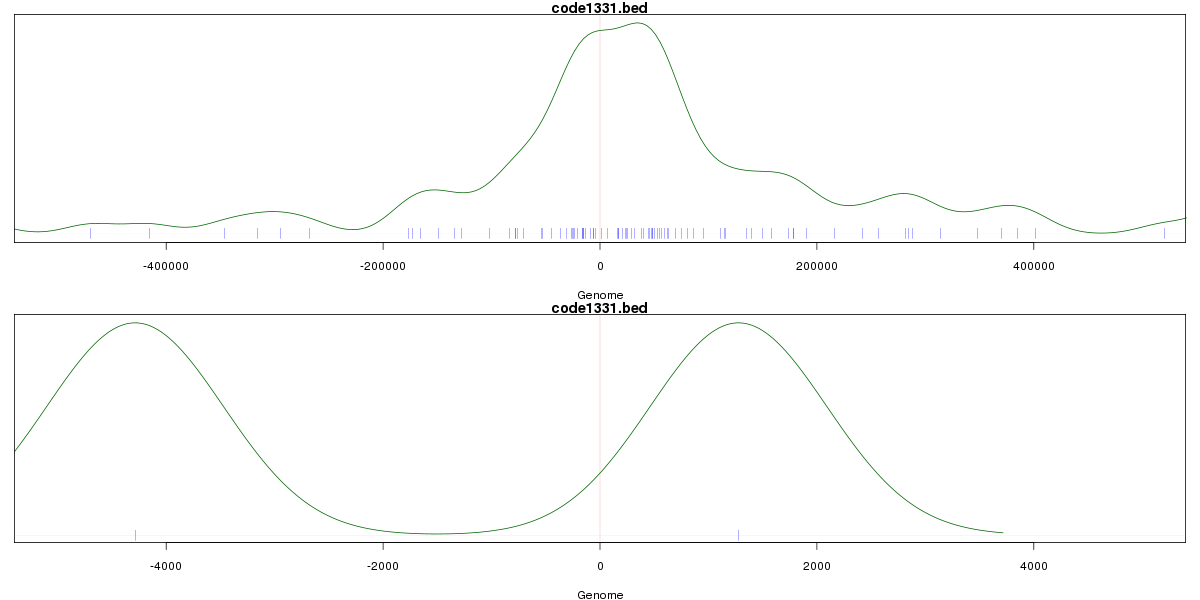
Stats
Number of sites: 2011Promoter: 0%
CpG-Island: 0%
Conserved: 33%
Enriched Motifs & Matches
Match Detail: [Jaspar]
|
| ||
|---|---|---|
| Sites: 56/100 | e-val: 2.3e-22 | ||
| Factor | e-val(match) | DB |
| HNF1A | 0.00027197 | JASPAR |
| HNF1B | 0.0003907 | JASPAR |
| Pax4 | 0.00041663 | JASPAR |
| ARID3A | 0.0014136 | JASPAR |
| Lhx3 | 0.0046106 | JASPAR |
|
| ||
| Sites: 19/100 | e-val: 0.0069 | ||
| Factor | e-val(match) | DB |
| Foxd3 | 0.0000025873 | JASPAR |
| MEF2A | 0.00030555 | JASPAR |
| Foxq1 | 0.00038475 | JASPAR |
| Foxa2 | 0.0015897 | JASPAR |
| ARID3A | 0.0041322 | JASPAR |
|
| ||
| Sites: 15/100 | e-val: 0.91 | ||
| Factor | e-val(match) | DB |
| Pax4 | 0.0003731 | JASPAR |
| HNF1A | 0.00068918 | JASPAR |
| Lhx3 | 0.0027834 | JASPAR |
| MEF2A | 0.0036532 | JASPAR |
| HNF1B | 0.0045366 | JASPAR |
BED file downloads
Top 10 Example Regions
| Location | Gene Link | Dist. |
|---|---|---|
| chr3: 36566180-36566330 | STAC | 31.85 |
| chr7: 106355340-106355490 | AC004917.1 | 33.67 |
| chr7: 106355340-106355490 | CCDC71L | 33.67 |
| chr1: 161691605-161691755 | FCRLB | 37.47 |
| chr13: 98855845-98855995 | FARP1 | 41.22 |
| chr1: 198071260-198071410 | NEK7 | 41.33 |
| chr12: 25983220-25983370 | RP11-443N24.1 | 42.34 |
| chr1: 115855600-115855750 | NGF | 43.42 |
| chr8: 74031040-74031190 | SBSPON | 44.84 |
| chr5: 152932600-152932750 | GRIA1 | 46.05 |