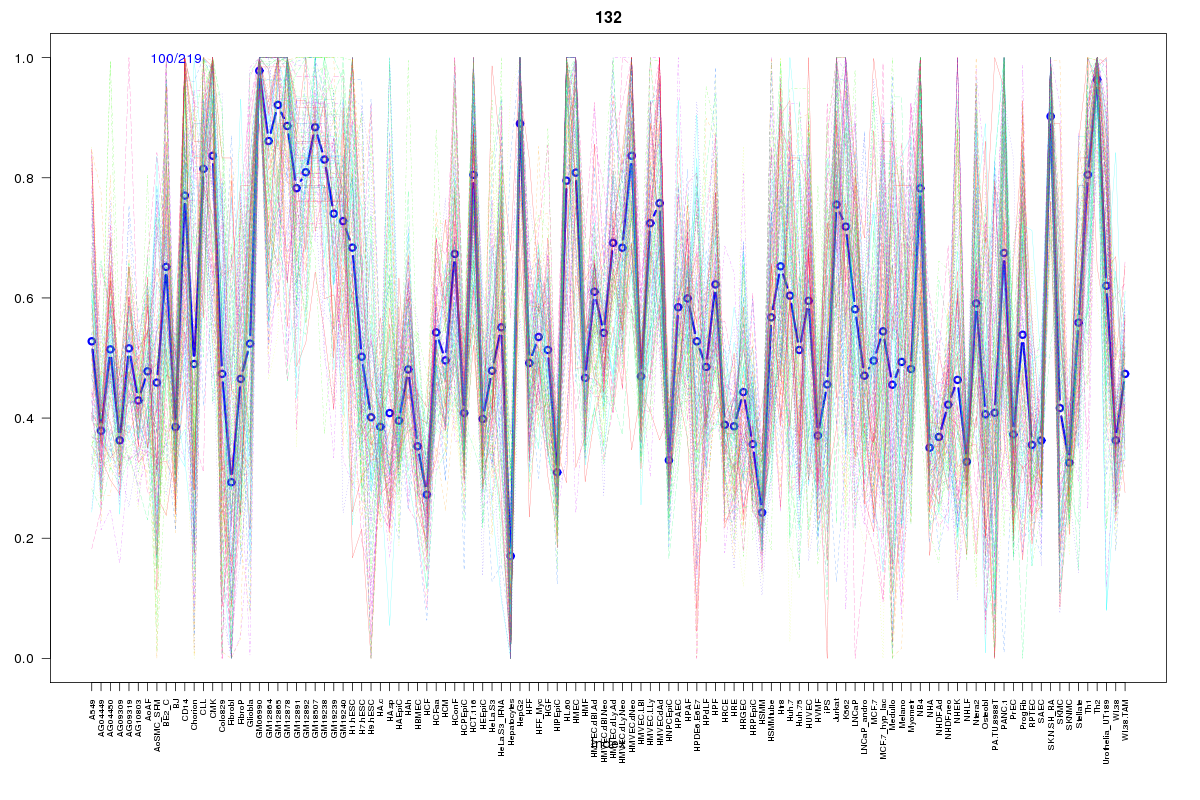
SOM cluster: 132
Cluster Hypersensitivity Profile

Genomic Location Trend
These plots show the distribution of the DHS sites surrounding the Transcript Start Site of the nearest gene.
Stats
Number of sites: 219Promoter: 60%
CpG-Island: 89%
Conserved: 69%
Enriched Motifs & Matches
Match Detail: [Jaspar]
|
| ||
|---|---|---|
| Sites: 95/100 | e-val: 0 | ||
| Factor | e-val(match) | DB |
| SP1 | 0.000000027347 | JASPAR |
| PLAG1 | 0.00031294 | JASPAR |
| Klf4 | 0.0018224 | JASPAR |
| TFAP2A | 0.0060666 | JASPAR |
| Egr1 | 0.018015 | JASPAR |
|
| ||
| Sites: 65/100 | e-val: 0.2 | ||
| Factor | e-val(match) | DB |
| TFAP2A | 0.0000057981 | JASPAR |
| SP1 | 0.0068465 | JASPAR |
| Klf4 | 0.0088992 | JASPAR |
| E2F1 | 0.014535 | JASPAR |
| NHLH1 | 0.044134 | JASPAR |
|
| ||
| Sites: 47/100 | e-val: 1.2 | ||
| Factor | e-val(match) | DB |
| E2F1 | 0.003025 | JASPAR |
| Egr1 | 0.0039562 | JASPAR |
| INSM1 | 0.02244 | JASPAR |
| REST | 0.024754 | JASPAR |
| TEAD1 | 0.026328 | JASPAR |
BED file downloads
Top 10 Example Regions
| Location | Gene Link | Dist. |
|---|---|---|
| chr11: 18548120-18548270 | LDHAL6A | 46.49 |
| chr1: 168148420-168148570 | GPR161 | 46.6 |
| chr19: 9732060-9732210 | ZNF121 | 47.73 |
| chr17: 76374620-76374770 | SOCS3 | 54.53 |
| chr2: 153032140-153032290 | CACNB4 | 57.61 |
| chrX: 100872940-100873090 | RP3-514P16.1 | 58.5 |
| chr8: 124286720-124286870 | ATAD2 | 59.66 |
| chr6: 32122420-32122570 | PBX2 | 62.96 |
| chr6: 32122420-32122570 | AGER | 62.96 |
| chr6: 32122420-32122570 | TNXB | 62.96 |