SOM cluster: 1316
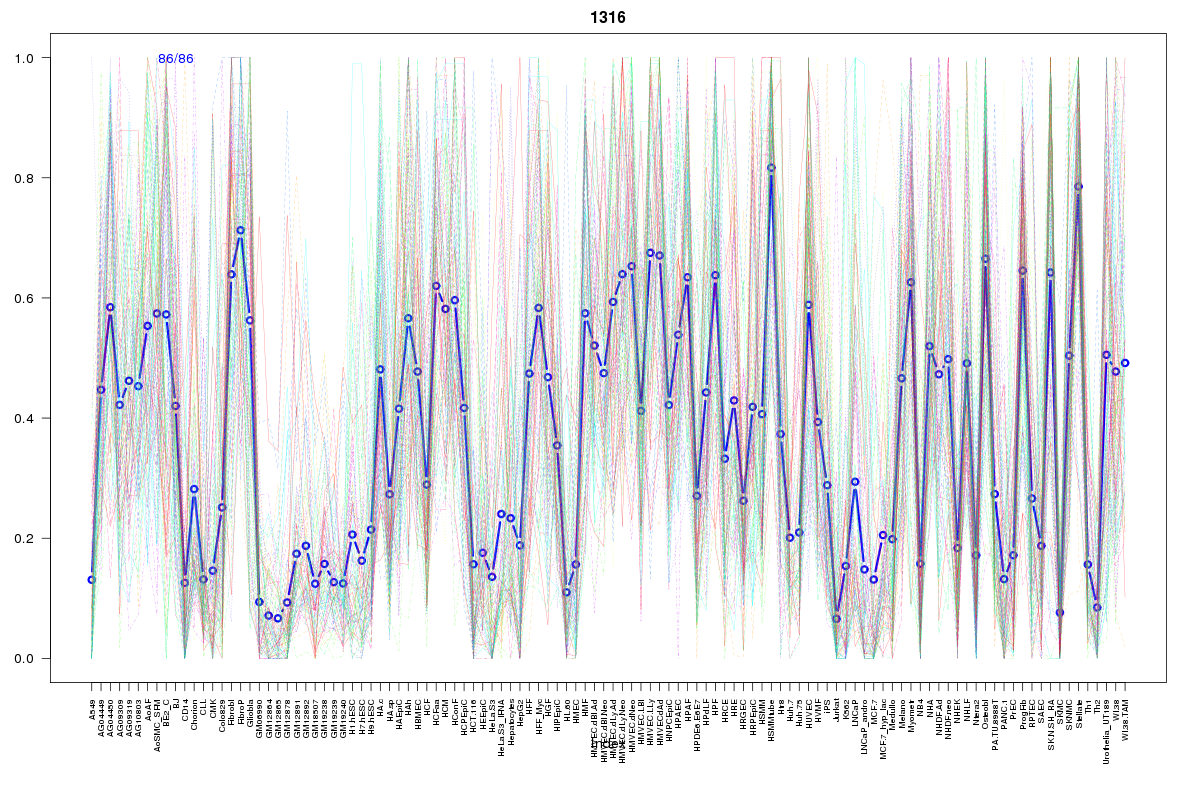
Cluster Hypersensitivity Profile

Genomic Location Trend
These plots show the distribution of the DHS sites surrounding the Transcript Start Site of the nearest gene.
Stats
Number of sites: 86Promoter: 9%
CpG-Island: 13%
Conserved: 52%
Enriched Motifs & Matches
Match Detail: [Jaspar]
|
| ||
|---|---|---|
| Sites: 79/86 | e-val: 3.9e-31 | ||
| Factor | e-val(match) | DB |
| SP1 | 0.0000002956 | JASPAR |
| PLAG1 | 0.000012606 | JASPAR |
| Klf4 | 0.00090818 | JASPAR |
| Pax4 | 0.0024422 | JASPAR |
| INSM1 | 0.0042516 | JASPAR |
|
| ||
| Sites: 45/86 | e-val: 0.00036 | ||
| Factor | e-val(match) | DB |
| Hand1::Tcfe2a | 0.003299 | JASPAR |
| REST | 0.013518 | JASPAR |
| Tcfcp2l1 | 0.016026 | JASPAR |
| Zfx | 0.024658 | JASPAR |
| RREB1 | 0.034436 | JASPAR |
BED file downloads
Top 10 Example Regions
| Location | Gene Link | Dist. |
|---|---|---|
| chr5: 176040980-176041130 | RNF44 | 54.69 |
| chr5: 176040980-176041130 | EIF4E1B | 54.69 |
| chr5: 176040980-176041130 | RN7SL684P | 54.69 |
| chr5: 176040980-176041130 | TSPAN17 | 54.69 |
| chr22: 25764340-25764490 | RP3-462D8.2 | 57.5 |
| chr7: 47611320-47611470 | TNS3 | 59.21 |
| chr1: 23203440-23203590 | EPHB2 | 64.62 |
| chrX: 73756320-73756470 | SLC16A2 | 71.05 |
| chr3: 195619700-195619850 | AC124944.5 | 71.29 |
| chr3: 195619700-195619850 | RNU2-11P | 71.29 |