SOM cluster: 1304
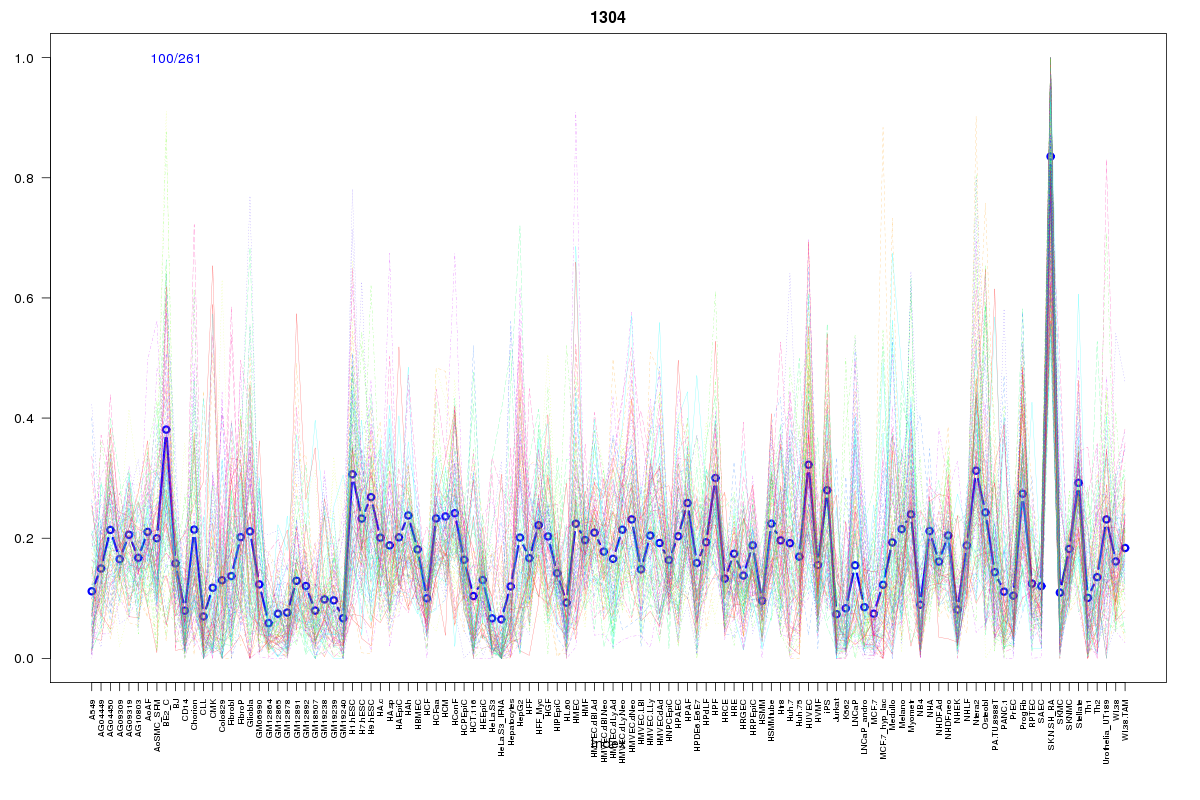
Cluster Hypersensitivity Profile

Genomic Location Trend
These plots show the distribution of the DHS sites surrounding the Transcript Start Site of the nearest gene.
Stats
Number of sites: 261Promoter: 32%
CpG-Island: 73%
Conserved: 69%
Enriched Motifs & Matches
Match Detail: [Jaspar]
|
| ||
|---|---|---|
| Sites: 81/100 | e-val: 0 | ||
| Factor | e-val(match) | DB |
| SP1 | 0.0000040397 | JASPAR |
| PLAG1 | 0.0019302 | JASPAR |
| TFAP2A | 0.0026068 | JASPAR |
| Egr1 | 0.039123 | JASPAR |
| MIZF | 0.069012 | JASPAR |
|
| ||
| Sites: 100/100 | e-val: 2.9e-26 | ||
| Factor | e-val(match) | DB |
| SP1 | 0.000070282 | JASPAR |
| EWSR1-FLI1 | 0.00090313 | JASPAR |
| PLAG1 | 0.0032627 | JASPAR |
| TFAP2A | 0.031288 | JASPAR |
| SPIB | 0.080268 | JASPAR |
BED file downloads
Top 10 Example Regions
| Location | Gene Link | Dist. |
|---|---|---|
| chr10: 31891740-31891890 | ZEB1 | 28.77 |
| chr8: 6407680-6407830 | RP11-115C21.4 | 37.42 |
| chr9: 129884660-129884810 | ANGPTL2 | 43.91 |
| chr19: 13129080-13129230 | NFIX | 51.28 |
| chr2: 74230025-74230175 | DGUOK | 53.08 |
| chr1: 156645340-156645490 | NES | 53.4 |
| chr2: 30453380-30453530 | AC104698.2 | 53.48 |
| chr2: 30453380-30453530 | AC104698.1 | 53.48 |
| chr6: 3231200-3231350 | TUBB2BP1 | 54.05 |
| chr6: 3231200-3231350 | TUBB2A | 54.05 |