SOM cluster: 1299
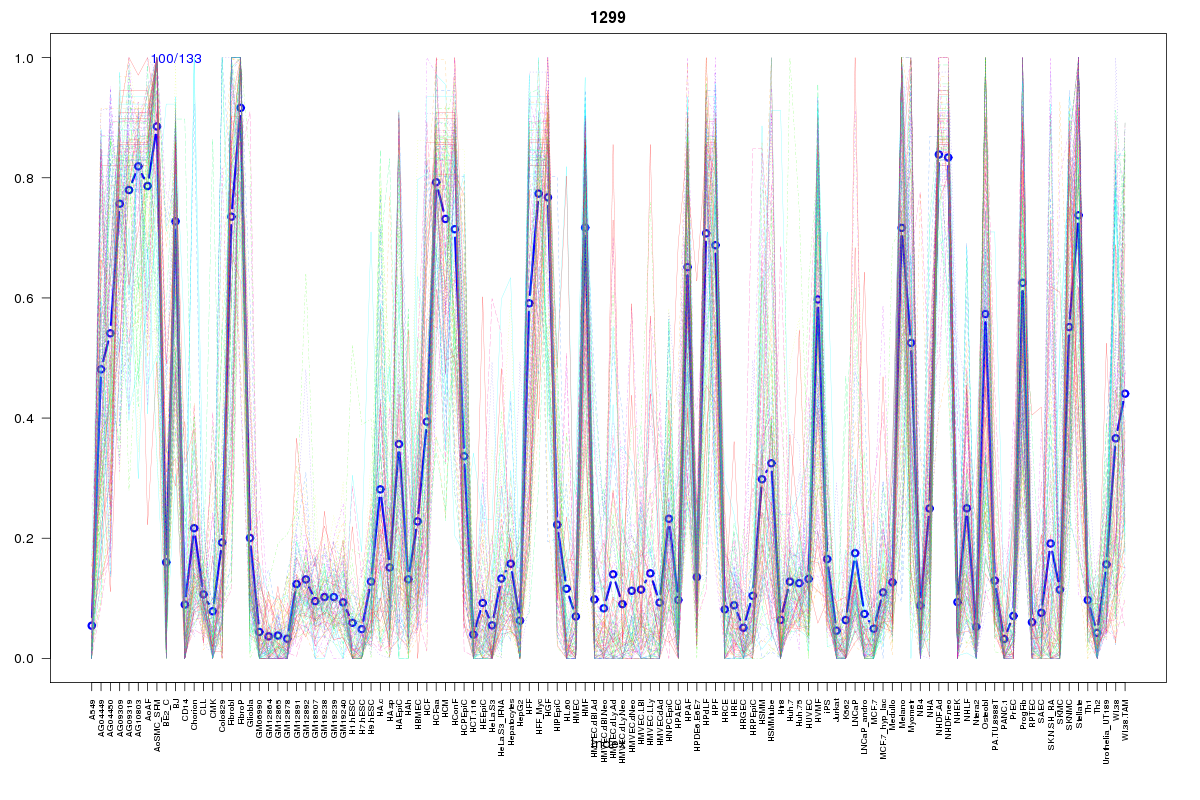
Cluster Hypersensitivity Profile

Genomic Location Trend
These plots show the distribution of the DHS sites surrounding the Transcript Start Site of the nearest gene.
Stats
Number of sites: 133Promoter: 6%
CpG-Island: 2%
Conserved: 62%
Enriched Motifs & Matches
Match Detail: [Jaspar]
|
| ||
|---|---|---|
| Sites: 19/100 | e-val: 0.00000011 | ||
| Factor | e-val(match) | DB |
| TAL1::TCF3 | 0.000026666 | JASPAR |
| HNF1A | 0.00035931 | JASPAR |
| Myf | 0.0017815 | JASPAR |
| Foxq1 | 0.0025865 | JASPAR |
| Evi1 | 0.0033936 | JASPAR |
|
| ||
| Sites: 25/100 | e-val: 0.037 | ||
| Factor | e-val(match) | DB |
| SP1 | 0.0000048506 | JASPAR |
| EWSR1-FLI1 | 0.0000072436 | JASPAR |
| Pax4 | 0.00046907 | JASPAR |
| INSM1 | 0.0036828 | JASPAR |
| znf143 | 0.0062365 | JASPAR |
BED file downloads
Top 10 Example Regions
| Location | Gene Link | Dist. |
|---|---|---|
| chr2: 128334020-128334170 | IWS1 | 38.69 |
| chr2: 64632980-64633130 | AC008074.3 | 52.2 |
| chr2: 64632980-64633130 | AC114752.3 | 52.2 |
| chr19: 10337140-10337290 | DNMT1 | 59.89 |
| chr19: 10337140-10337290 | CTD-2369P2.2 | 59.89 |
| chr19: 10337140-10337290 | ZGLP1 | 59.89 |
| chr19: 10337140-10337290 | MRPL4 | 59.89 |
| chr5: 32190340-32190490 | PDZD2 | 61.35 |
| chr5: 32190340-32190490 | MTMR12 | 61.35 |
| chr22: 31472080-31472230 | INPP5J | 63.1 |