SOM cluster: 1296
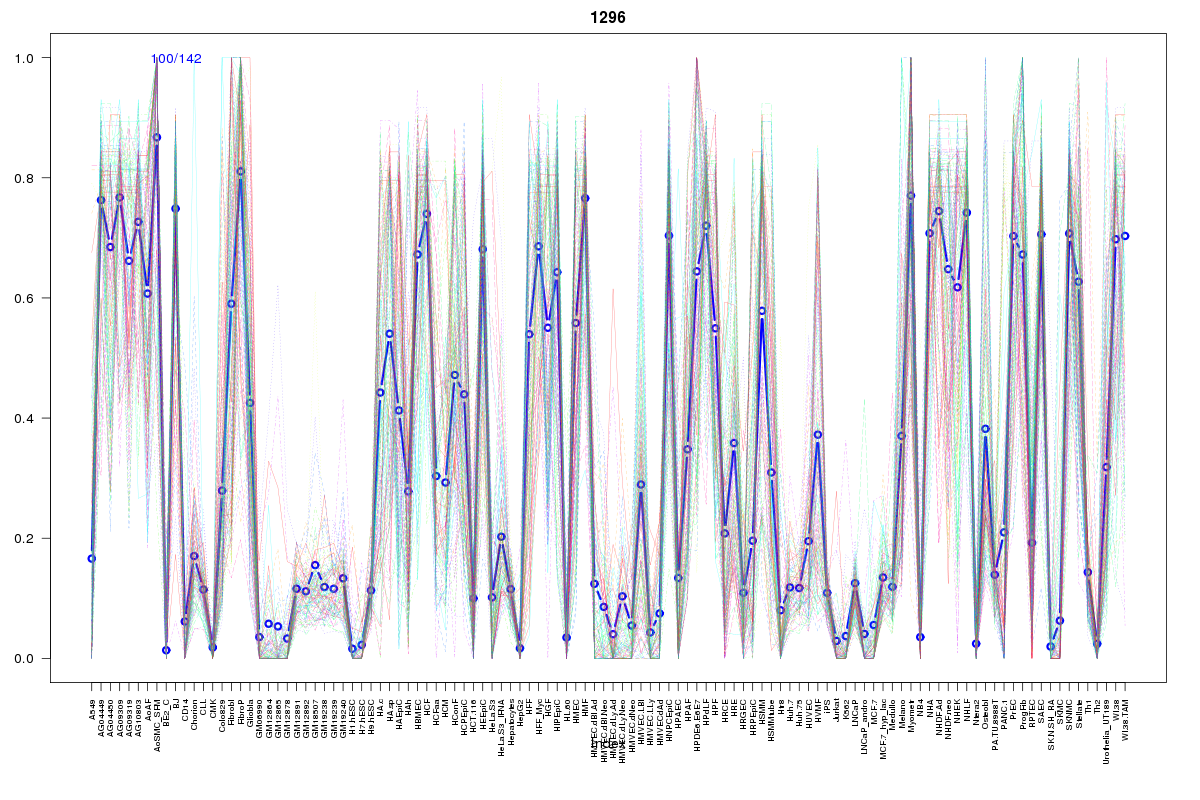
Cluster Hypersensitivity Profile

Genomic Location Trend
These plots show the distribution of the DHS sites surrounding the Transcript Start Site of the nearest gene.
Stats
Number of sites: 142Promoter: 2%
CpG-Island: 0%
Conserved: 37%
Enriched Motifs & Matches
Match Detail: [Jaspar]
|
| ||
|---|---|---|
| Sites: 53/100 | e-val: 0.000000000000033 | ||
| Factor | e-val(match) | DB |
| AP1 | 0.000000000025997 | JASPAR |
| NFE2L2 | 0.0000000073725 | JASPAR |
| PPARG | 0.0059227 | JASPAR |
| NFE2L1::MafG | 0.0070393 | JASPAR |
| Foxa2 | 0.013415 | JASPAR |
BED file downloads
Top 10 Example Regions
| Location | Gene Link | Dist. |
|---|---|---|
| chr17: 15295880-15296030 | RN7SL792P | 41.3 |
| chr1: 170592420-170592570 | PRRX1 | 41.42 |
| chr18: 55566100-55566250 | RSL24D1P11 | 58.64 |
| chr6: 42375260-42375410 | TRERF1 | 59.13 |
| chr19: 48594720-48594870 | LIG1 | 59.68 |
| chr19: 48594720-48594870 | PLA2G4C | 59.68 |
| chr8: 13305620-13305770 | DLC1 | 65.09 |
| chr3: 187485180-187485330 | BCL6 | 68.16 |
| chr5: 9014100-9014250 | SEMA5A | 71.43 |
| chr7: 129134000-129134150 | SMKR1 | 72.89 |