SOM cluster: 129
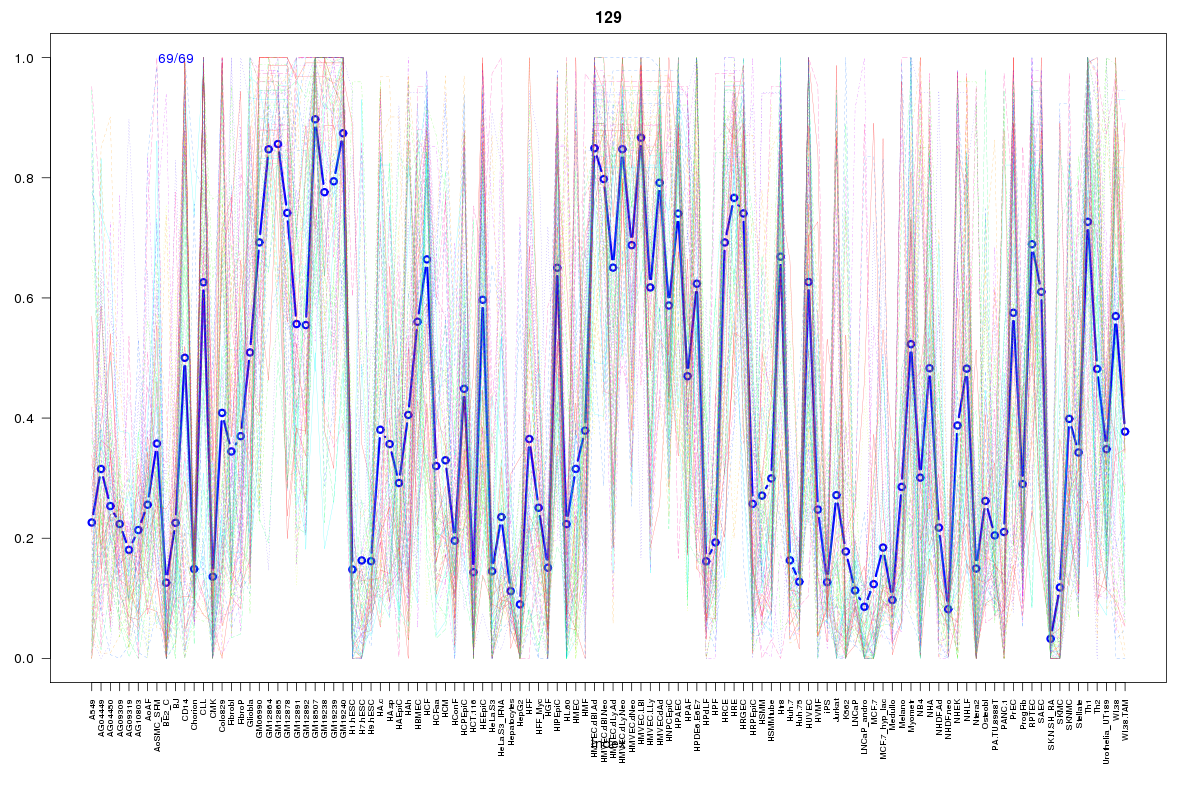
Cluster Hypersensitivity Profile

Genomic Location Trend
These plots show the distribution of the DHS sites surrounding the Transcript Start Site of the nearest gene.
Stats
Number of sites: 69Promoter: 1%
CpG-Island: 0%
Conserved: 38%
Enriched Motifs & Matches
Match Detail: [Jaspar]
|
| ||
|---|---|---|
| Sites: 19/69 | e-val: 0.0000018 | ||
| Factor | e-val(match) | DB |
| FEV | 0.000000039046 | JASPAR |
| SPI1 | 0.00000047001 | JASPAR |
| ELF5 | 0.0000080372 | JASPAR |
| GABPA | 0.00070312 | JASPAR |
| EWSR1-FLI1 | 0.00077854 | JASPAR |
|
| ||
| Sites: 25/69 | e-val: 0.37 | ||
| Factor | e-val(match) | DB |
| NFE2L2 | 0.000000000085989 | JASPAR |
| AP1 | 0.000000021583 | JASPAR |
| NFE2L1::MafG | 0.00031643 | JASPAR |
| znf143 | 0.007949 | JASPAR |
| Pax2 | 0.028754 | JASPAR |
BED file downloads
Top 10 Example Regions
| Location | Gene Link | Dist. |
|---|---|---|
| chr4: 144280300-144280450 | GAB1 | 48.6 |
| chr10: 45916060-45916210 | ALOX5 | 54.93 |
| chr5: 159895120-159895270 | C5orf54 | 57.66 |
| chr5: 159895120-159895270 | MIR146A | 57.66 |
| chr13: 43072080-43072230 | TNFSF11 | 60.25 |
| chr10: 3853700-3853850 | KLF6 | 63.15 |
| chr9: 111864280-111864430 | MIR32 | 64.26 |
| chr9: 111864280-111864430 | TMEM245 | 64.26 |
| chr2: 28904180-28904330 | AC097724.3 | 65.18 |
| chr11: 109948780-109948930 | ZC3H12C | 71.67 |