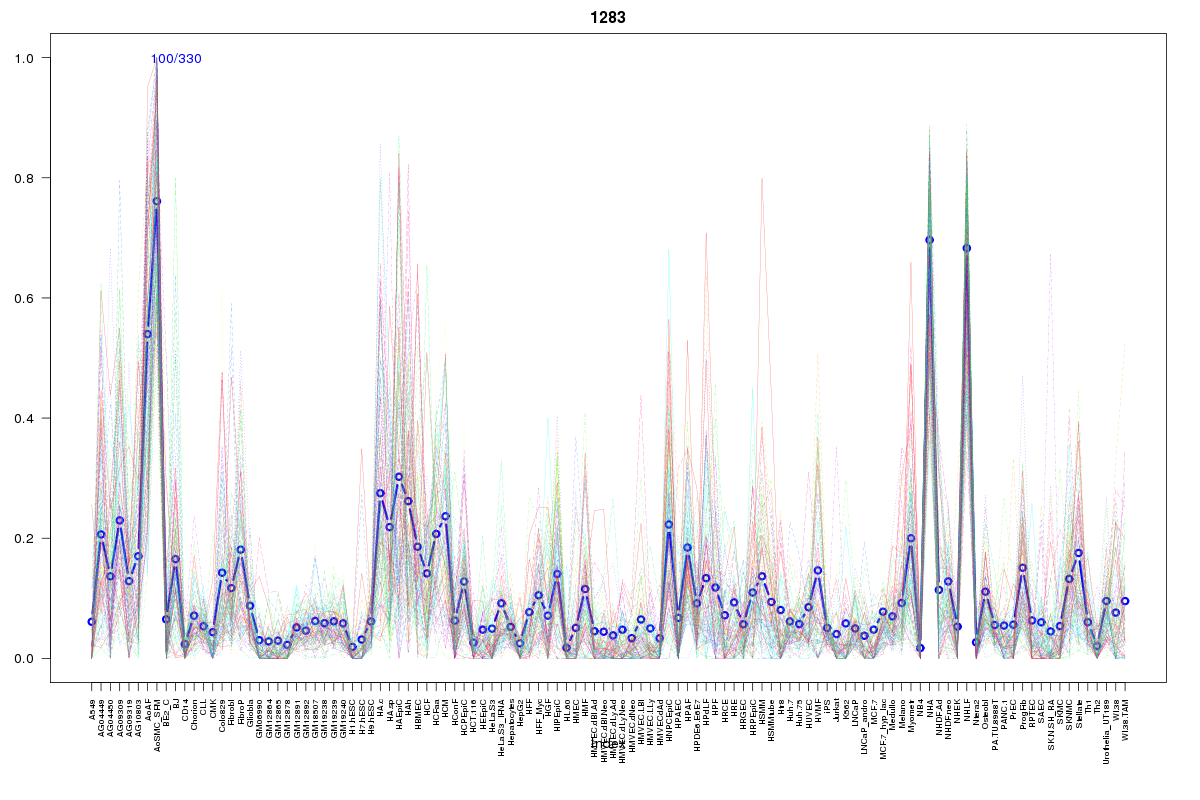
SOM cluster: 1283
Cluster Hypersensitivity Profile

Genomic Location Trend
These plots show the distribution of the DHS sites surrounding the Transcript Start Site of the nearest gene.
Stats
Number of sites: 330Promoter: 1%
CpG-Island: 0%
Conserved: 42%
Enriched Motifs & Matches
Match Detail: [Jaspar]
|
| ||
|---|---|---|
| Sites: 29/100 | e-val: 2.6 | ||
| Factor | e-val(match) | DB |
| HNF1B | 0.00034899 | JASPAR |
| Prrx2 | 0.0025516 | JASPAR |
| Lhx3 | 0.0036083 | JASPAR |
| HNF1A | 0.010855 | JASPAR |
| HOXA5 | 0.017108 | JASPAR |
|
| ||
| Sites: 24/100 | e-val: 0.00047 | ||
| Factor | e-val(match) | DB |
| RELA | 0.000018594 | JASPAR |
| TEAD1 | 0.000058518 | JASPAR |
| NF-kappaB | 0.00037522 | JASPAR |
| SPI1 | 0.00057563 | JASPAR |
| REL | 0.0022484 | JASPAR |
BED file downloads
Top 10 Example Regions
| Location | Gene Link | Dist. |
|---|---|---|
| chr1: 117531040-117531190 | PTGFRN | 58.18 |
| chr11: 122214020-122214170 | RP11-716H6.1 | 58.34 |
| chr11: 122214020-122214170 | RP11-820L6.1 | 58.34 |
| chr7: 124633340-124633490 | POT1-AS1 | 63.7 |
| chr7: 124633340-124633490 | EEF1GP1 | 63.7 |
| chr1: 78475660-78475810 | NEXN | 63.94 |
| chr2: 207450240-207450390 | ADAM23 | 64.04 |
| chr12: 63086620-63086770 | MON2 | 70.74 |
| chr12: 63086620-63086770 | MIRLET7I | 70.74 |
| chr22: 33236200-33236350 | TIMP3 | 70.82 |