SOM cluster: 127
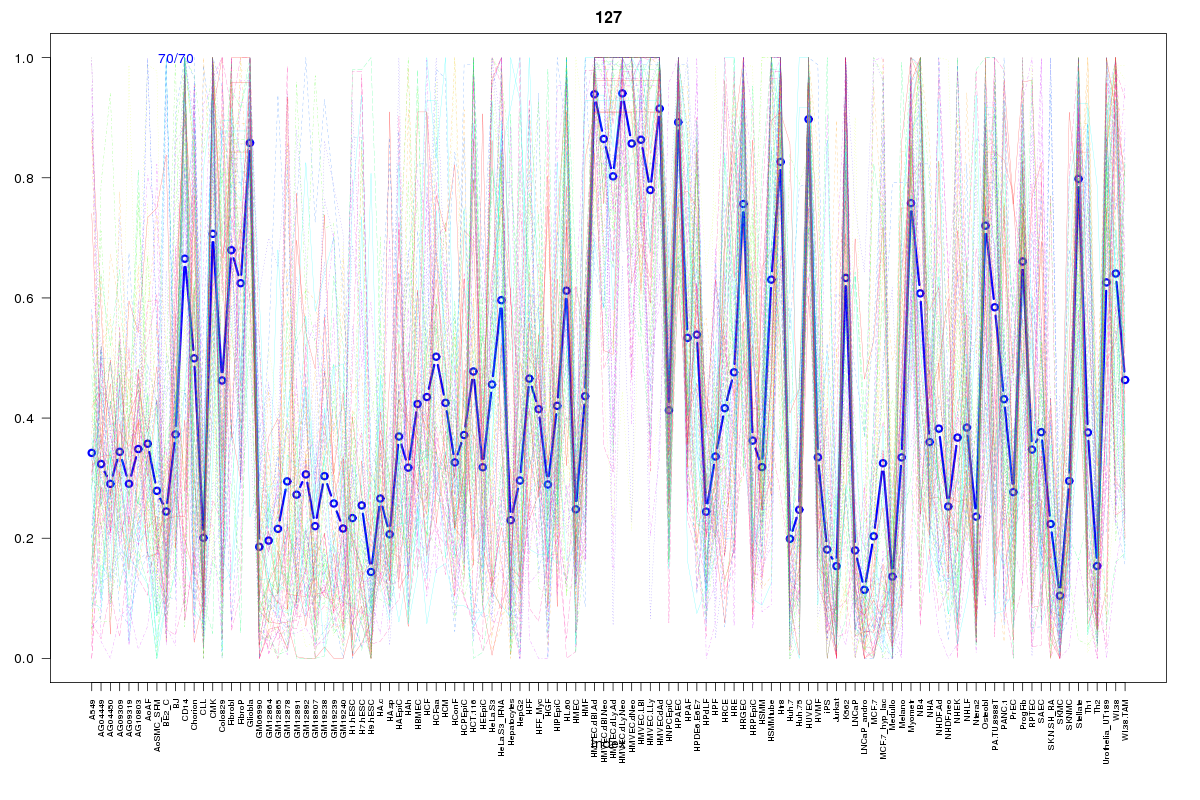
Cluster Hypersensitivity Profile

Genomic Location Trend
These plots show the distribution of the DHS sites surrounding the Transcript Start Site of the nearest gene.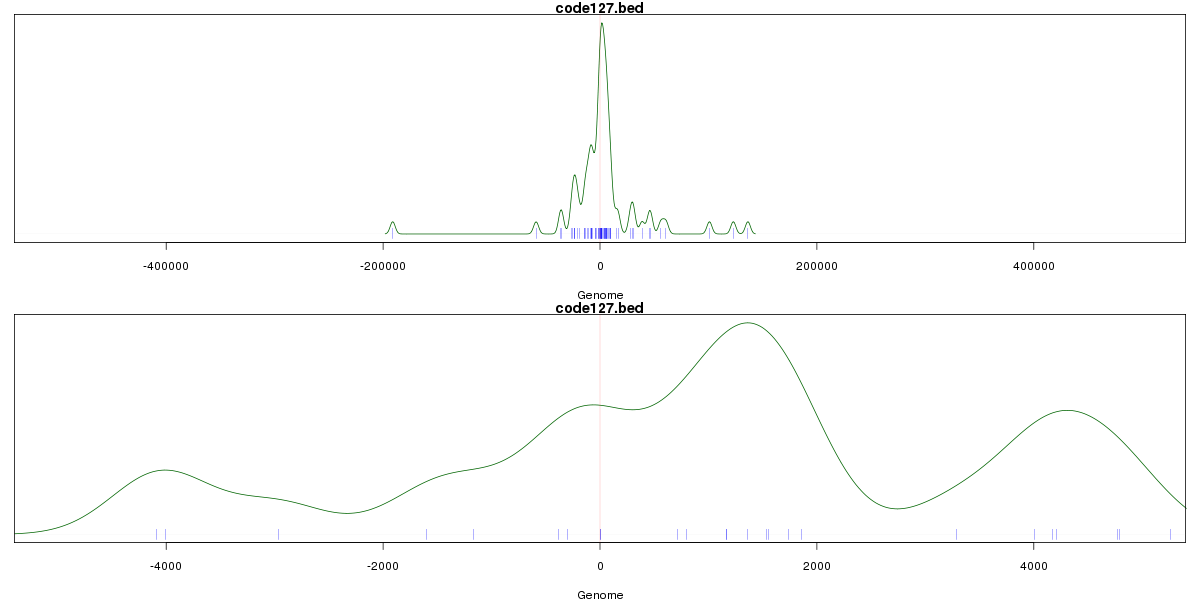
Stats
Number of sites: 70Promoter: 11%
CpG-Island: 5%
Conserved: 46%
Enriched Motifs & Matches
Match Detail: [Jaspar]
|
| ||
|---|---|---|
| Sites: 47/70 | e-val: 0 | ||
| Factor | e-val(match) | DB |
| NFE2L2 | 0.0000000089447 | JASPAR |
| AP1 | 0.00000033833 | JASPAR |
| NFE2L1::MafG | 0.059477 | JASPAR |
| Pax2 | 0.089809 | JASPAR |
| SP1 | 0.10373 | JASPAR |
|
| ||
| Sites: 37/70 | e-val: 3.1e-20 | ||
| Factor | e-val(match) | DB |
| Pax4 | 0.00013829 | JASPAR |
| SP1 | 0.00094295 | JASPAR |
| ESR1 | 0.0011307 | JASPAR |
| Tal1::Gata1 | 0.0029676 | JASPAR |
| PPARG::RXRA | 0.0034053 | JASPAR |
|
| ||
| Sites: 54/70 | e-val: 0.00000012 | ||
| Factor | e-val(match) | DB |
| SPI1 | 0.00000025918 | JASPAR |
| FEV | 0.00000048227 | JASPAR |
| Stat3 | 0.00000085179 | JASPAR |
| TEAD1 | 0.0000028973 | JASPAR |
| SPIB | 0.0000034546 | JASPAR |
BED file downloads
Top 10 Example Regions
| Location | Gene Link | Dist. |
|---|---|---|
| chr3: 129318480-129318630 | RHO | 42.21 |
| chr3: 129318480-129318630 | PLXND1 | 42.21 |
| chr4: 8193000-8193150 | SH3TC1 | 43.84 |
| chr6: 16239980-16240130 | GMPR | 49.56 |
| chr11: 128778560-128778710 | KCNJ1 | 58.53 |
| chr17: 43523400-43523550 | ARHGAP27 | 66.92 |
| chr17: 43523400-43523550 | PLEKHM1 | 66.92 |
| chr12: 111847760-111847910 | SH2B3 | 71.26 |
| chr17: 76983020-76983170 | CANT1 | 76.56 |
| chr16: 81585180-81585330 | CMIP | 78.78 |