SOM cluster: 1265
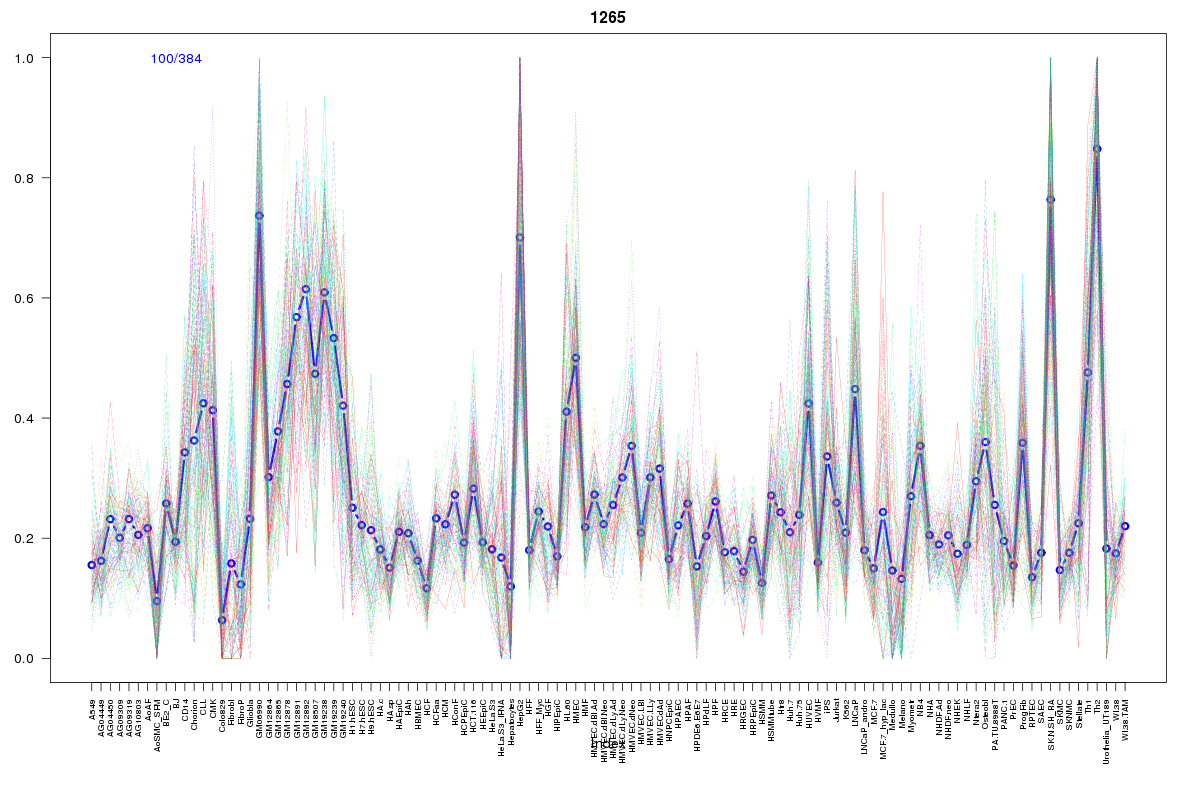
Cluster Hypersensitivity Profile

Genomic Location Trend
These plots show the distribution of the DHS sites surrounding the Transcript Start Site of the nearest gene.
Stats
Number of sites: 384Promoter: 28%
CpG-Island: 99%
Conserved: 84%
Enriched Motifs & Matches
Match Detail: [Jaspar]
|
| ||
|---|---|---|
| Sites: 98/100 | e-val: 0 | ||
| Factor | e-val(match) | DB |
| SP1 | 0.000018122 | JASPAR |
| TFAP2A | 0.00022769 | JASPAR |
| PLAG1 | 0.00030529 | JASPAR |
| Klf4 | 0.024214 | JASPAR |
| Egr1 | 0.084885 | JASPAR |
|
| ||
| Sites: 93/100 | e-val: 0 | ||
| Factor | e-val(match) | DB |
| SP1 | 0.000010728 | JASPAR |
| TFAP2A | 0.00029876 | JASPAR |
| PLAG1 | 0.0023123 | JASPAR |
| Klf4 | 0.0031363 | JASPAR |
| Zfx | 0.0045748 | JASPAR |
|
| ||
| Sites: 57/100 | e-val: 3.2e-18 | ||
| Factor | e-val(match) | DB |
| SP1 | 0.0000011543 | JASPAR |
| TFAP2A | 0.000047174 | JASPAR |
| Egr1 | 0.0052396 | JASPAR |
| Zfx | 0.010207 | JASPAR |
| Klf4 | 0.028383 | JASPAR |
BED file downloads
Top 10 Example Regions
| Location | Gene Link | Dist. |
|---|---|---|
| chr10: 3110400-3110550 | PFKP | 27.03 |
| chr9: 131939845-131939995 | IER5L | 43.86 |
| chr1: 6685640-6685790 | RNU6-731P | 45.61 |
| chr6: 35310465-35310615 | DEF6 | 49.17 |
| chr2: 65216780-65216930 | SLC1A4 | 50.48 |
| chr1: 173446720-173446870 | PRDX6 | 50.91 |
| chr19: 58661820-58661970 | ZNF544 | 52.46 |
| chr19: 58661820-58661970 | ZNF135 | 52.46 |
| chr17: 1957325-1957475 | SMG6 | 54.11 |
| chr17: 1957325-1957475 | HIC1 | 54.11 |