SOM cluster: 1262
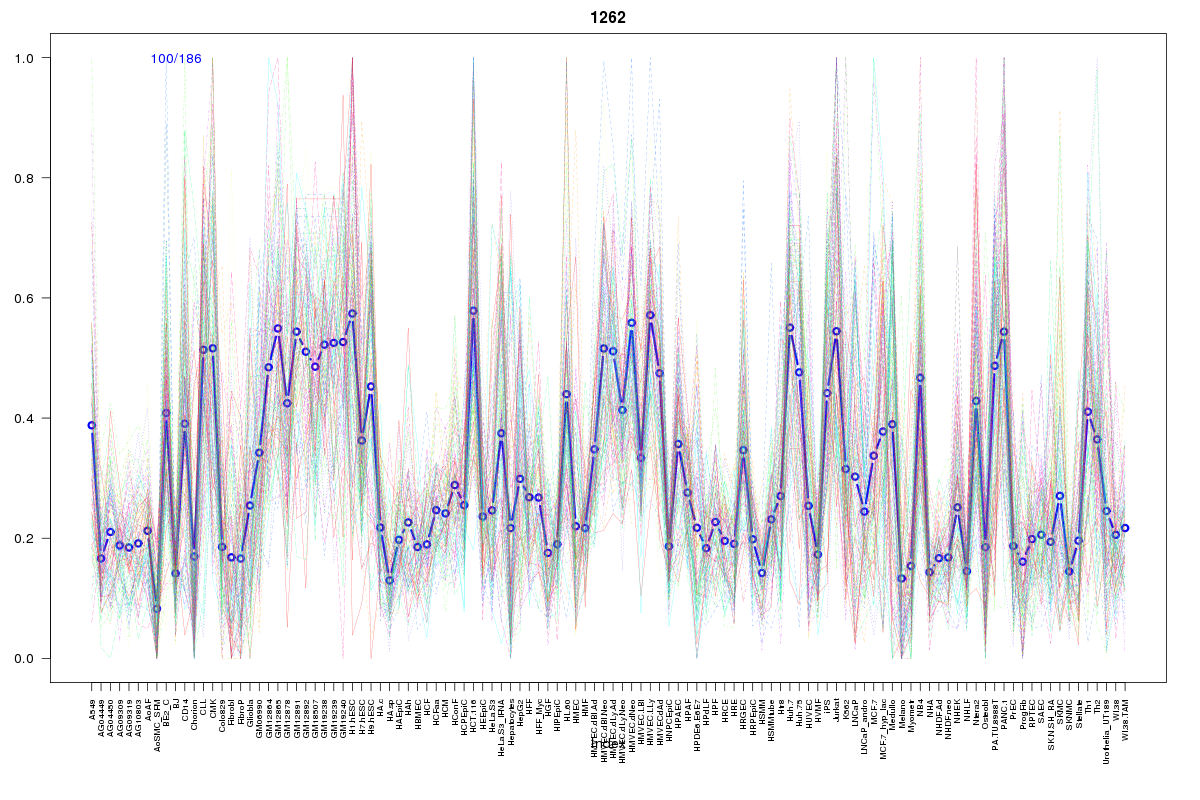
Cluster Hypersensitivity Profile

Genomic Location Trend
These plots show the distribution of the DHS sites surrounding the Transcript Start Site of the nearest gene.
Stats
Number of sites: 186Promoter: 9%
CpG-Island: 2%
Conserved: 39%
Enriched Motifs & Matches
Match Detail: [Jaspar]
|
| ||
|---|---|---|
| Sites: 73/100 | e-val: 0 | ||
| Factor | e-val(match) | DB |
| CTCF | 0 | JASPAR |
| INSM1 | 0.000000086358 | JASPAR |
| MYC::MAX | 0.0017119 | JASPAR |
| SP1 | 0.001738 | JASPAR |
| Zfp423 | 0.0066418 | JASPAR |
|
| ||
| Sites: 32/100 | e-val: 0.0000007 | ||
| Factor | e-val(match) | DB |
| RREB1 | 0.0000010168 | JASPAR |
| Pax4 | 0.0000016135 | JASPAR |
| Klf4 | 0.000043497 | JASPAR |
| ZNF354C | 0.0001115 | JASPAR |
| Tal1::Gata1 | 0.00026012 | JASPAR |
BED file downloads
Top 10 Example Regions
| Location | Gene Link | Dist. |
|---|---|---|
| chr1: 154792205-154792355 | KCNN3 | 39.44 |
| chr19: 1935600-1935750 | ADAT3 | 42.98 |
| chr19: 1935600-1935750 | CSNK1G2-AS1 | 42.98 |
| chr17: 9869060-9869210 | GAS7 | 43.77 |
| chr1: 38027520-38027670 | SNIP1 | 50.28 |
| chr1: 38027520-38027670 | DNALI1 | 50.28 |
| chr7: 98984620-98984770 | ATP5J2 | 52.48 |
| chr11: 8936080-8936230 | ST5 | 54.03 |
| chr11: 8936080-8936230 | RP11-467K18.2 | 54.03 |
| chr11: 66246500-66246650 | DPP3 | 54.68 |