SOM cluster: 1255
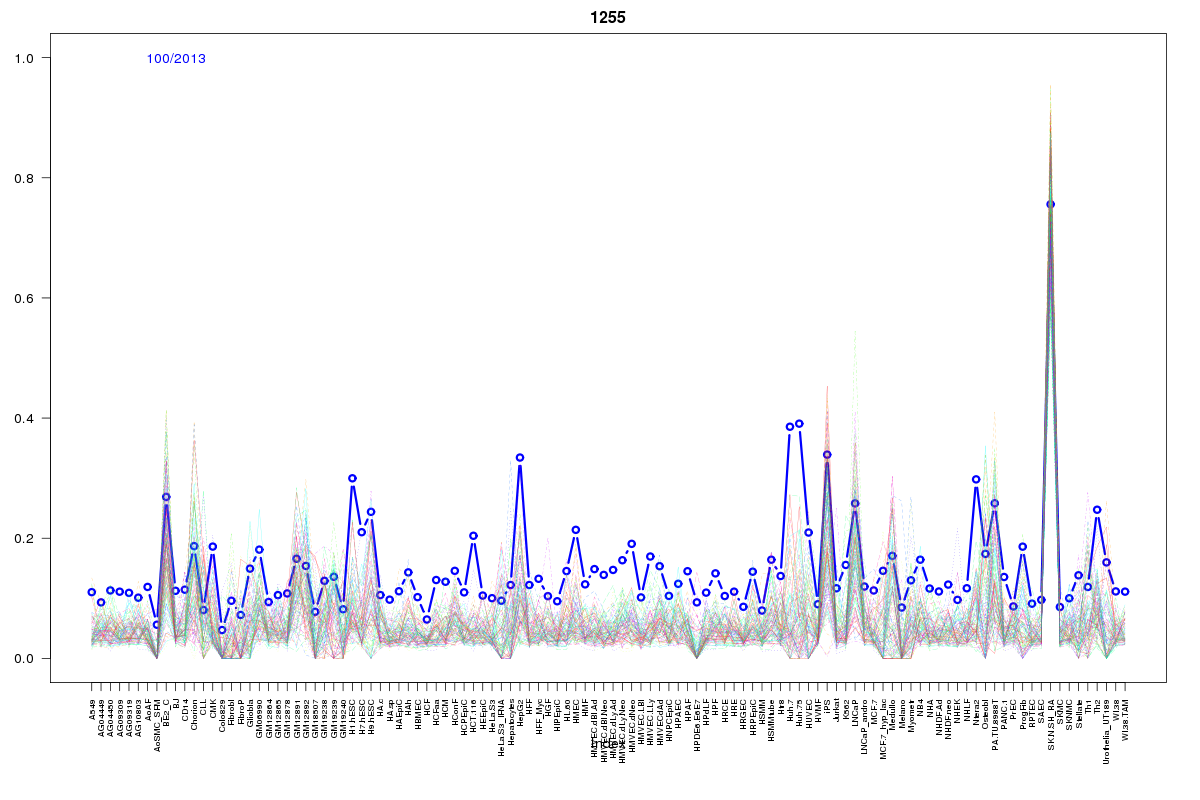
Cluster Hypersensitivity Profile

Genomic Location Trend
These plots show the distribution of the DHS sites surrounding the Transcript Start Site of the nearest gene.
Stats
Number of sites: 2013Promoter: 3%
CpG-Island: 18%
Conserved: 35%
Enriched Motifs & Matches
Match Detail: [Jaspar]
|
| ||
|---|---|---|
| Sites: 95/100 | e-val: 0 | ||
| Factor | e-val(match) | DB |
| TFAP2A | 0.000039765 | JASPAR |
| SP1 | 0.00016734 | JASPAR |
| Klf4 | 0.0054253 | JASPAR |
| Egr1 | 0.0072393 | JASPAR |
| INSM1 | 0.02185 | JASPAR |
|
| ||
| Sites: 89/100 | e-val: 8.2e-39 | ||
| Factor | e-val(match) | DB |
| SP1 | 0.00000029025 | JASPAR |
| PLAG1 | 0.00011254 | JASPAR |
| INSM1 | 0.00018305 | JASPAR |
| RREB1 | 0.00030291 | JASPAR |
| Klf4 | 0.0014049 | JASPAR |
|
| ||
| Sites: 98/100 | e-val: 0.0000000065 | ||
| Factor | e-val(match) | DB |
| Stat3 | 0.0030015 | JASPAR |
| INSM1 | 0.0060047 | JASPAR |
| FEV | 0.037495 | JASPAR |
| SPI1 | 0.041224 | JASPAR |
| TFAP2A | 0.080403 | JASPAR |
|
| ||
| Sites: 21/100 | e-val: 2.6 | ||
| Factor | e-val(match) | DB |
| Stat3 | 0.00027717 | JASPAR |
| FEV | 0.0026382 | JASPAR |
| Zfx | 0.0038851 | JASPAR |
| Hand1::Tcfe2a | 0.016478 | JASPAR |
| ESR1 | 0.0169 | JASPAR |
BED file downloads
Top 10 Example Regions
| Location | Gene Link | Dist. |
|---|---|---|
| chr19: 34288985-34289135 | KCTD15 | 39.56 |
| chr1: 149400240-149400390 | RP11-403I13.9 | 44.43 |
| chr11: 2015165-2015315 | H19 | 47.38 |
| chr9: 124313100-124313250 | RP11-524G24.2 | 47.7 |
| chrX: 83443165-83443315 | RPS6KA6 | 48.1 |
| chr9: 132320545-132320695 | RP11-483H20.4 | 48.39 |
| chr11: 64036020-64036170 | GPR137 | 48.71 |
| chr3: 123751505-123751655 | KALRN | 49.26 |
| chr1: 94702720-94702870 | snoU13 | 49.97 |
| chr3: 42947685-42947835 | ZNF662 | 50.58 |