SOM cluster: 1253
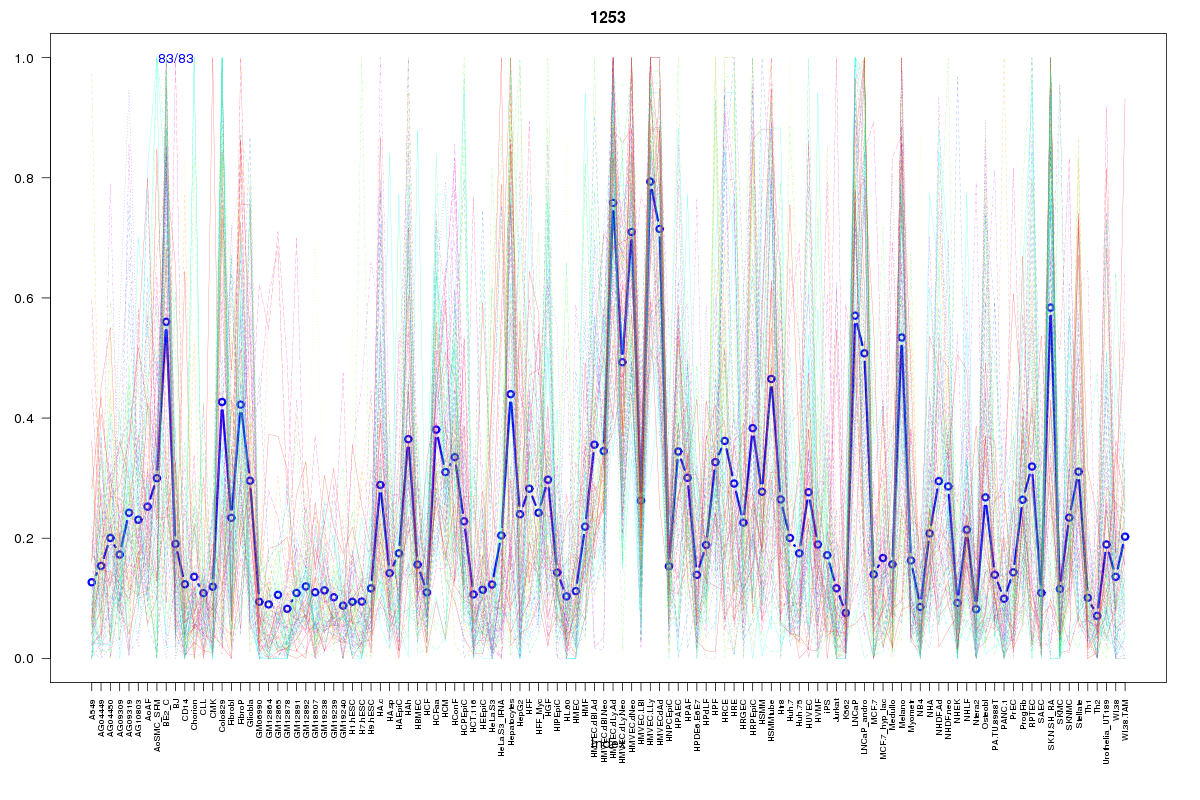
Cluster Hypersensitivity Profile

Genomic Location Trend
These plots show the distribution of the DHS sites surrounding the Transcript Start Site of the nearest gene.
Stats
Number of sites: 83Promoter: 7%
CpG-Island: 4%
Conserved: 48%
Enriched Motifs & Matches
Match Detail: [Jaspar]
|
| ||
|---|---|---|
| Sites: 62/83 | e-val: 2.70451e-43 | ||
| Factor | e-val(match) | DB |
| TLX1::NFIC | 0.000000000070421 | JASPAR |
| ESR2 | 0.0014174 | JASPAR |
| ESR1 | 0.0049196 | JASPAR |
| PPARG | 0.0089117 | JASPAR |
| SP1 | 0.056548 | JASPAR |
|
| ||
| Sites: 46/83 | e-val: 0.000047 | ||
| Factor | e-val(match) | DB |
| SP1 | 0.0000057756 | JASPAR |
| Klf4 | 0.0074392 | JASPAR |
| Tal1::Gata1 | 0.0086417 | JASPAR |
| EWSR1-FLI1 | 0.0095229 | JASPAR |
| INSM1 | 0.012807 | JASPAR |
|
| ||
| Sites: 29/83 | e-val: 2.2 | ||
| Factor | e-val(match) | DB |
| Zfx | 0.0000039468 | JASPAR |
| TP53 | 0.00016349 | JASPAR |
| TFAP2A | 0.00073446 | JASPAR |
| Egr1 | 0.0011044 | JASPAR |
| SP1 | 0.0038402 | JASPAR |
BED file downloads
Top 10 Example Regions
| Location | Gene Link | Dist. |
|---|---|---|
| chr11: 62269120-62269270 | CTD-2531D15.4 | 45.31 |
| chr22: 46926680-46926830 | CELSR1 | 62.13 |
| chr22: 46926680-46926830 | RP3-439F8.1 | 62.13 |
| chr9: 116925940-116926090 | COL27A1 | 65.55 |
| chr1: 2391340-2391490 | RP3-395M20.8 | 66.92 |
| chr1: 2391340-2391490 | PLCH2 | 66.92 |
| chr6: 110736660-110736810 | DDO | 68.38 |
| chr17: 38488760-38488910 | RARA | 69.84 |
| chr1: 33476940-33477090 | RP4-803A2.2 | 71.66 |
| chr17: 76320485-76320635 | RN7SL236P | 72.69 |