SOM cluster: 125
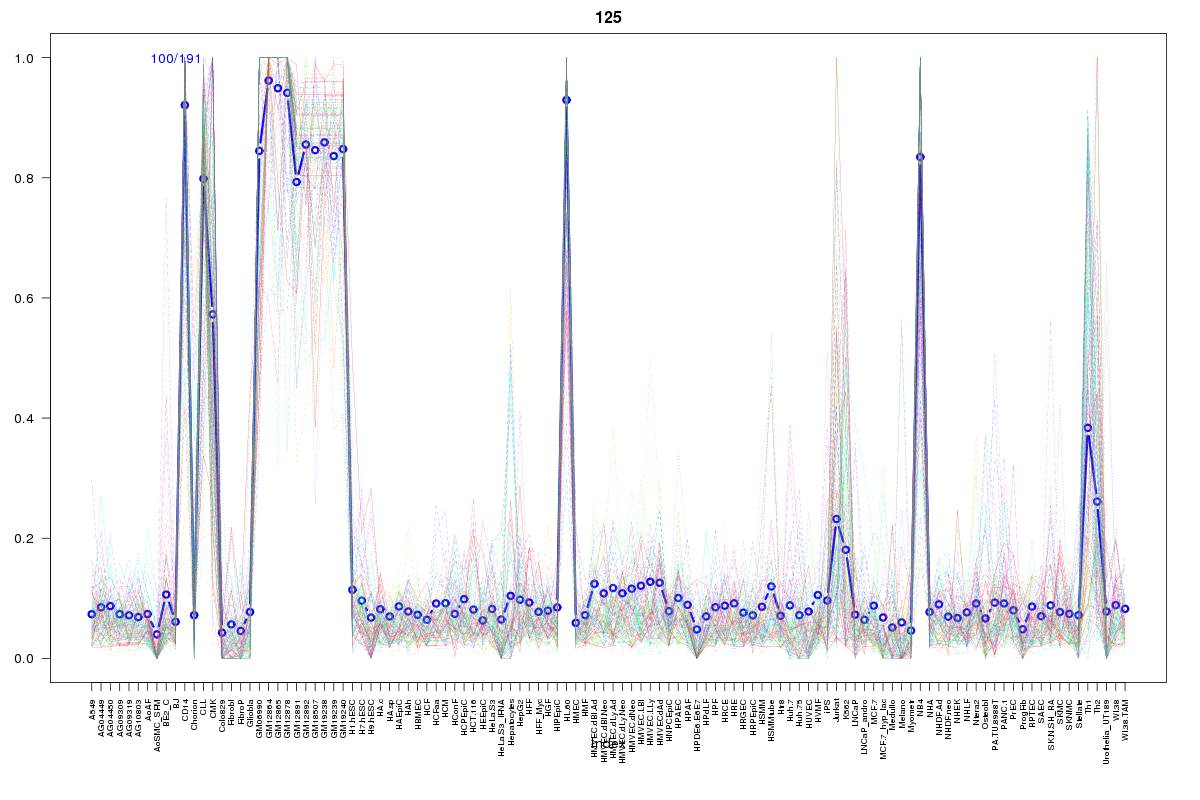
Cluster Hypersensitivity Profile

Genomic Location Trend
These plots show the distribution of the DHS sites surrounding the Transcript Start Site of the nearest gene.
Stats
Number of sites: 191Promoter: 13%
CpG-Island: 1%
Conserved: 45%
Enriched Motifs & Matches
Match Detail: [Jaspar]
|
| ||
|---|---|---|
| Sites: 71/100 | e-val: 0 | ||
| Factor | e-val(match) | DB |
| SPI1 | 0.000000018684 | JASPAR |
| SPIB | 0.00000038216 | JASPAR |
| FEV | 0.000055456 | JASPAR |
| GABPA | 0.00023699 | JASPAR |
| ELK4 | 0.00033507 | JASPAR |
|
| ||
| Sites: 32/100 | e-val: 0.036 | ||
| Factor | e-val(match) | DB |
| Klf4 | 0.00000086937 | JASPAR |
| SP1 | 0.00012347 | JASPAR |
| RREB1 | 0.0010412 | JASPAR |
| INSM1 | 0.0059577 | JASPAR |
| TFAP2A | 0.0073912 | JASPAR |
|
| ||
| Sites: 23/100 | e-val: 0.0068 | ||
| Factor | e-val(match) | DB |
| PLAG1 | 0.000032987 | JASPAR |
| TFAP2A | 0.00027525 | JASPAR |
| EBF1 | 0.00033803 | JASPAR |
| Zfp423 | 0.0084623 | JASPAR |
| REST | 0.019014 | JASPAR |
BED file downloads
Top 10 Example Regions
| Location | Gene Link | Dist. |
|---|---|---|
| chr10: 14690200-14690350 | FAM107B | 41.24 |
| chr17: 56017220-56017370 | SRSF1 | 49.52 |
| chr17: 56017220-56017370 | CUEDC1 | 49.52 |
| chr22: 35806140-35806290 | MCM5 | 51.37 |
| chr1: 11025120-11025270 | C1orf127 | 55.84 |
| chr5: 1494980-1495130 | SLC6A3 | 59.9 |
| chr19: 3180420-3180570 | GNA11 | 60.47 |
| chr19: 3180420-3180570 | S1PR4 | 60.47 |
| chr19: 3180420-3180570 | CELF5 | 60.47 |
| chr19: 3180420-3180570 | GNA15 | 60.47 |