SOM cluster: 1223
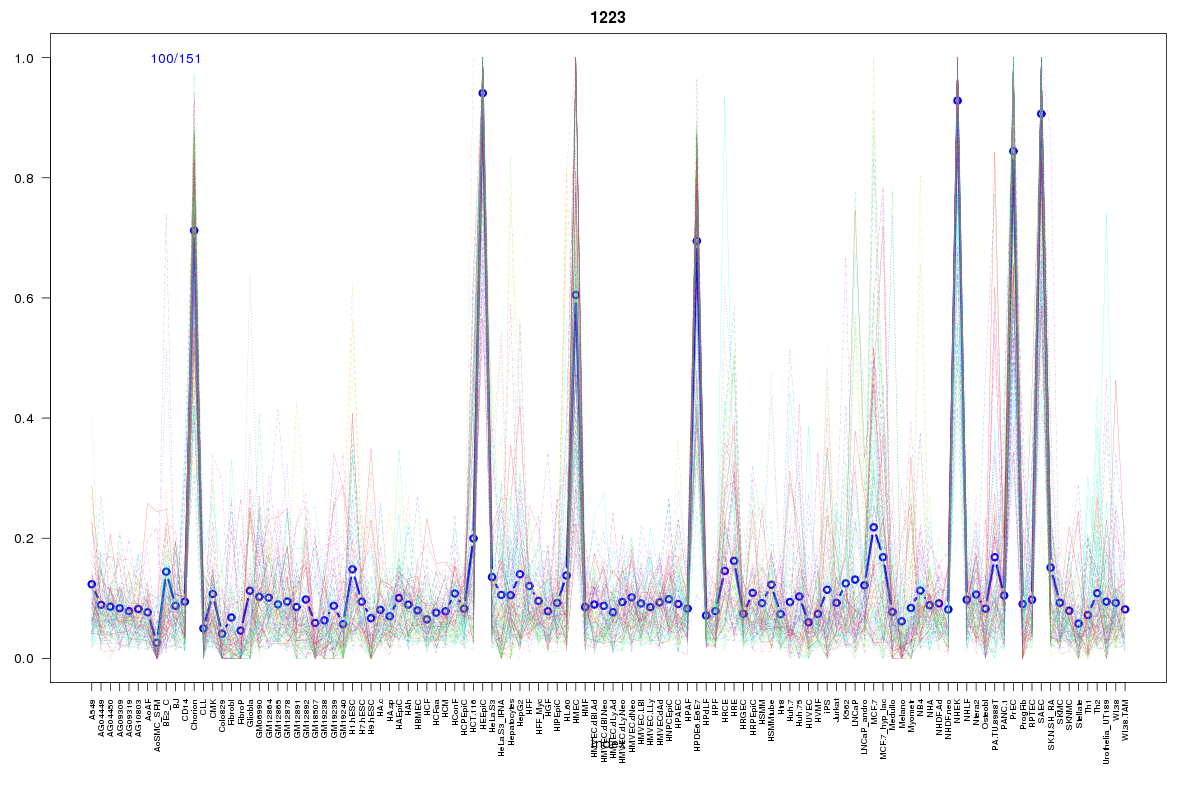
Cluster Hypersensitivity Profile

Genomic Location Trend
These plots show the distribution of the DHS sites surrounding the Transcript Start Site of the nearest gene.
Stats
Number of sites: 151Promoter: 13%
CpG-Island: 6%
Conserved: 46%
Enriched Motifs & Matches
Match Detail: [Jaspar]
|
| ||
|---|---|---|
| Sites: 47/100 | e-val: 0.00000000000034 | ||
| Factor | e-val(match) | DB |
| TP53 | 0.00000000054048 | JASPAR |
| Zfx | 0.00022517 | JASPAR |
| Tcfcp2l1 | 0.00036848 | JASPAR |
| Klf4 | 0.0048202 | JASPAR |
| Egr1 | 0.013226 | JASPAR |
|
| ||
| Sites: 41/100 | e-val: 0.000015 | ||
| Factor | e-val(match) | DB |
| SP1 | 0.00000018984 | JASPAR |
| RREB1 | 0.00018588 | JASPAR |
| Klf4 | 0.0012884 | JASPAR |
| EWSR1-FLI1 | 0.0017389 | JASPAR |
| PPARG::RXRA | 0.0026815 | JASPAR |
|
| ||
| Sites: 26/100 | e-val: 0.38 | ||
| Factor | e-val(match) | DB |
| AP1 | 0.00000000004146 | JASPAR |
| NFE2L2 | 0.0000000025113 | JASPAR |
| Foxa2 | 0.0045367 | JASPAR |
| NFE2L1::MafG | 0.0047519 | JASPAR |
| PPARG | 0.0068476 | JASPAR |
BED file downloads
Top 10 Example Regions
| Location | Gene Link | Dist. |
|---|---|---|
| chr1: 201366780-201366930 | RP11-134G8.2 | 42.16 |
| chr1: 201366780-201366930 | PKP1 | 42.16 |
| chr1: 201366780-201366930 | LAD1 | 42.16 |
| chr1: 201366780-201366930 | RP11-134G8.8 | 42.16 |
| chr19: 35587100-35587250 | GRAMD1A | 48.57 |
| chr19: 35587100-35587250 | FXYD3 | 48.57 |
| chr14: 23308460-23308610 | OXA1L | 49.45 |
| chr20: 46294105-46294255 | SULF2 | 64.87 |
| chr20: 46294105-46294255 | CTD-2653D5.1 | 64.87 |
| chr8: 144655980-144656130 | 7SK | 67.06 |