SOM cluster: 1218
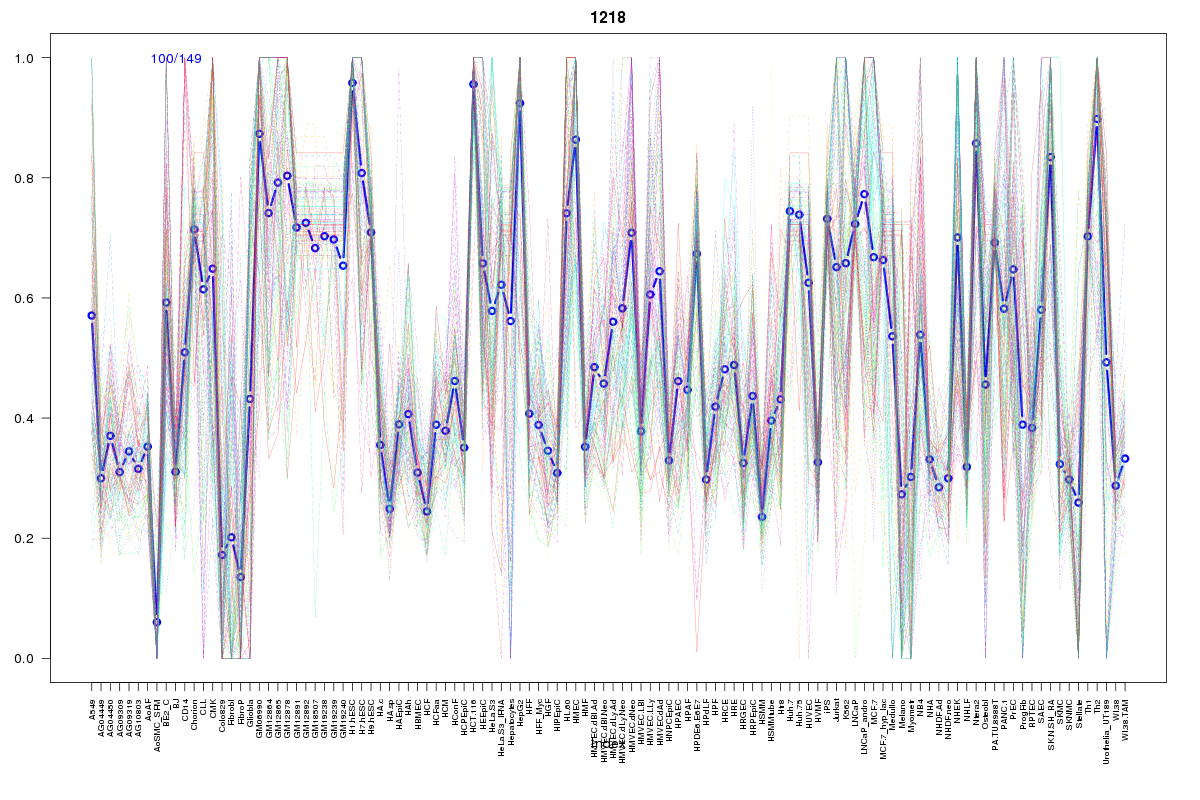
Cluster Hypersensitivity Profile

Genomic Location Trend
These plots show the distribution of the DHS sites surrounding the Transcript Start Site of the nearest gene.
Stats
Number of sites: 149Promoter: 47%
CpG-Island: 63%
Conserved: 79%
Enriched Motifs & Matches
Match Detail: [Jaspar]
|
| ||
|---|---|---|
| Sites: 81/100 | e-val: 0 | ||
| Factor | e-val(match) | DB |
| SP1 | 0.0000040541 | JASPAR |
| Klf4 | 0.00045577 | JASPAR |
| TFAP2A | 0.0031279 | JASPAR |
| PLAG1 | 0.0071033 | JASPAR |
| Zfx | 0.0099198 | JASPAR |
|
| ||
| Sites: 83/100 | e-val: 1.3e-27 | ||
| Factor | e-val(match) | DB |
| TFAP2A | 0.000051756 | JASPAR |
| SP1 | 0.00026545 | JASPAR |
| Klf4 | 0.0041647 | JASPAR |
| INSM1 | 0.0067957 | JASPAR |
| Zfx | 0.019231 | JASPAR |
|
| ||
| Sites: 62/100 | e-val: 0.015 | ||
| Factor | e-val(match) | DB |
| SP1 | 0.00008013 | JASPAR |
| Pax4 | 0.001189 | JASPAR |
| CTCF | 0.0032841 | JASPAR |
| NHLH1 | 0.017262 | JASPAR |
| Myf | 0.02002 | JASPAR |
BED file downloads
Top 10 Example Regions
| Location | Gene Link | Dist. |
|---|---|---|
| chr8: 56792240-56792390 | LYN | 36.18 |
| chr8: 81083760-81083910 | TPD52 | 39.07 |
| chr9: 36400220-36400370 | RNF38 | 54.47 |
| chr4: 110651080-110651230 | CASP6 | 56.92 |
| chr9: 130370720-130370870 | FAM129B | 60.11 |
| chr8: 145016360-145016510 | PLEC | 62.78 |
| chr8: 145016360-145016510 | PARP10 | 62.78 |
| chr8: 145016360-145016510 | NRBP2 | 62.78 |
| chr19: 36001360-36001510 | DMKN | 64.48 |
| chr16: 2244985-2245135 | ECI1 | 66.14 |