SOM cluster: 1210
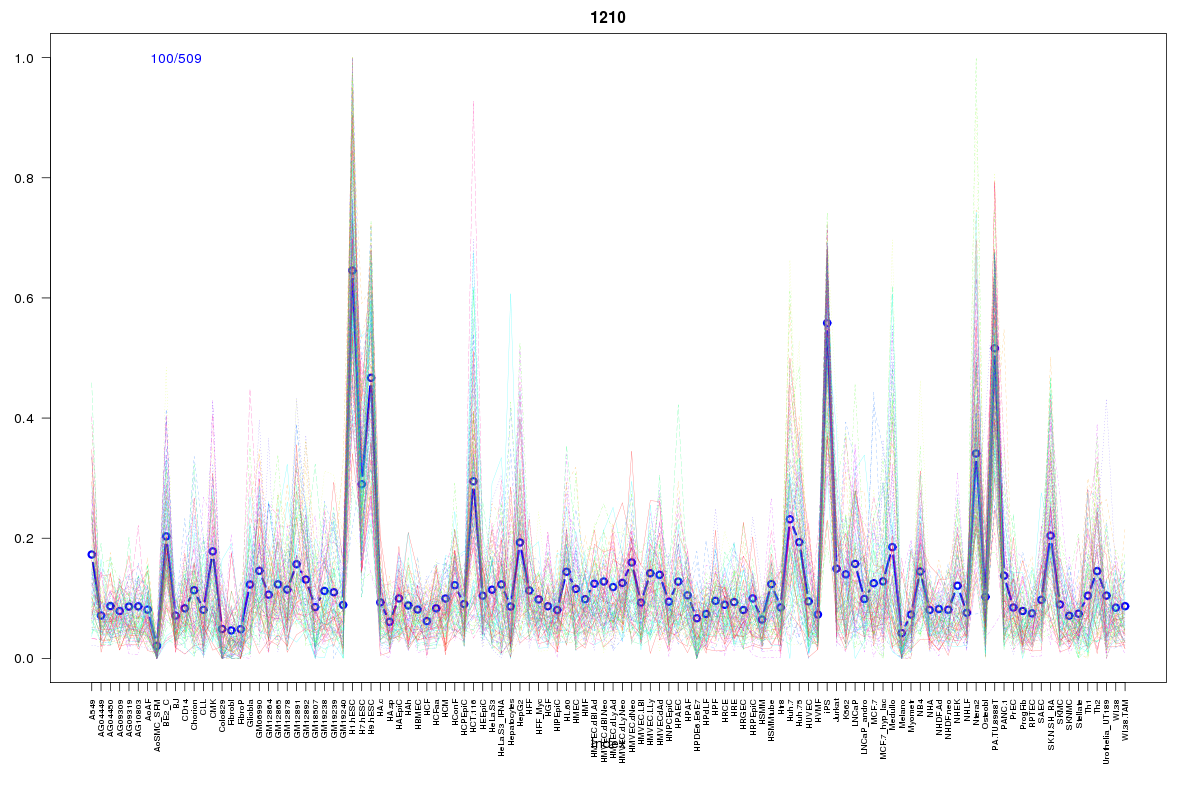
Cluster Hypersensitivity Profile

Genomic Location Trend
These plots show the distribution of the DHS sites surrounding the Transcript Start Site of the nearest gene.
Stats
Number of sites: 509Promoter: 9%
CpG-Island: 18%
Conserved: 41%
Enriched Motifs & Matches
Match Detail: [Jaspar]
|
| ||
|---|---|---|
| Sites: 83/100 | e-val: 0 | ||
| Factor | e-val(match) | DB |
| CTCF | 0 | JASPAR |
| INSM1 | 0.0000082604 | JASPAR |
| SP1 | 0.00050731 | JASPAR |
| MYC::MAX | 0.0015668 | JASPAR |
| PLAG1 | 0.0082342 | JASPAR |
|
| ||
| Sites: 68/100 | e-val: 1.4e-35 | ||
| Factor | e-val(match) | DB |
| SP1 | 0.00000000002866 | JASPAR |
| Egr1 | 0.000037288 | JASPAR |
| Klf4 | 0.00013136 | JASPAR |
| Pax4 | 0.0012845 | JASPAR |
| TP53 | 0.010949 | JASPAR |
|
| ||
| Sites: 73/100 | e-val: 0.074 | ||
| Factor | e-val(match) | DB |
| TP53 | 0.008068 | JASPAR |
| PLAG1 | 0.011982 | JASPAR |
| Zfx | 0.021845 | JASPAR |
| ESR1 | 0.025266 | JASPAR |
| RORA_1 | 0.027211 | JASPAR |
|
| ||
| Sites: 29/100 | e-val: 0.00003 | ||
| Factor | e-val(match) | DB |
| Myf | 0.00000012064 | JASPAR |
| NHLH1 | 0.000029014 | JASPAR |
| Myc | 0.0028546 | JASPAR |
| CTCF | 0.0039448 | JASPAR |
| EWSR1-FLI1 | 0.0064467 | JASPAR |
BED file downloads
Top 10 Example Regions
| Location | Gene Link | Dist. |
|---|---|---|
| chr11: 47182965-47183115 | DDB2 | 35.69 |
| chr9: 139509760-139509910 | EGFL7 | 37.48 |
| chr3: 127092945-127093095 | RP11-88I21.2 | 41.42 |
| chr8: 131029145-131029295 | FAM49B | 44.09 |
| chr19: 33210545-33210695 | TDRD12 | 46.09 |
| chr9: 138696885-138697035 | CAMSAP1 | 48.32 |
| chr19: 30251280-30251430 | CCNE1 | 48.36 |
| chr2: 71091705-71091855 | VAX2 | 49.49 |
| chr2: 71091705-71091855 | LINC01143 | 49.49 |
| chr16: 49525905-49526055 | ZNF423 | 50.24 |