SOM cluster: 1205
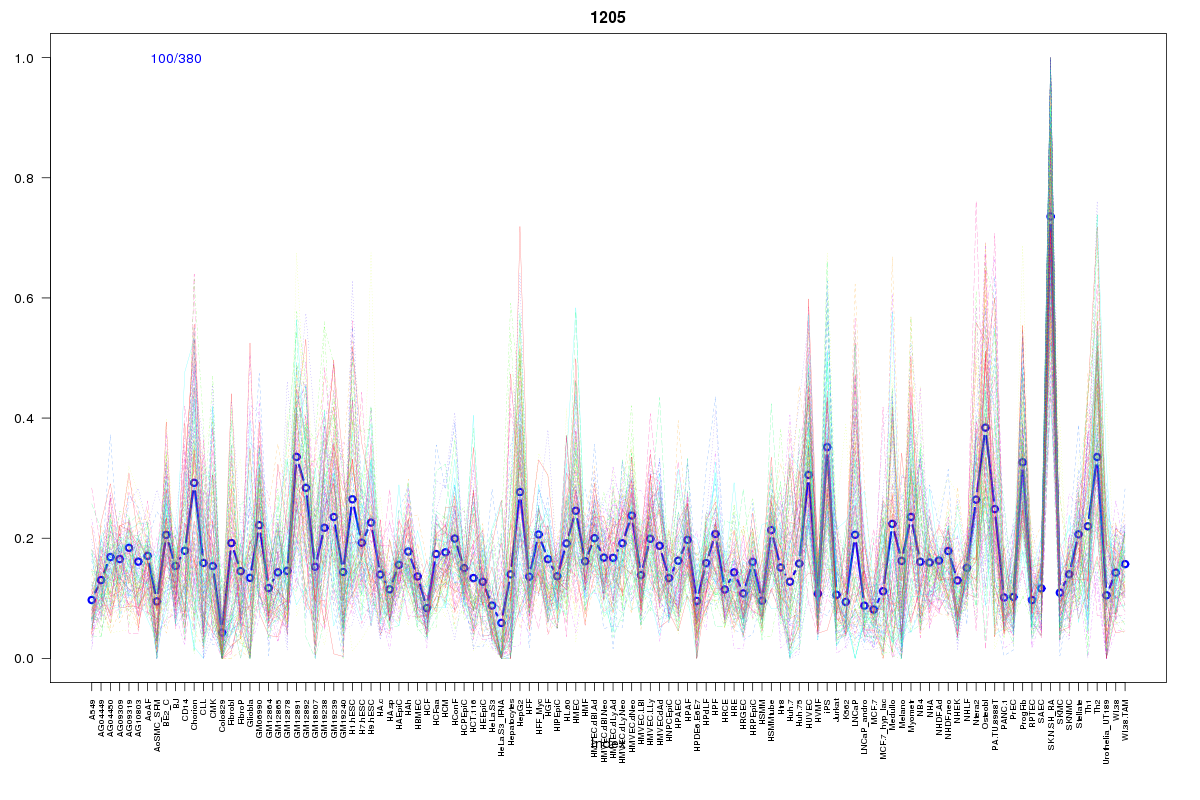
Cluster Hypersensitivity Profile

Genomic Location Trend
These plots show the distribution of the DHS sites surrounding the Transcript Start Site of the nearest gene.
Stats
Number of sites: 380Promoter: 23%
CpG-Island: 93%
Conserved: 71%
Enriched Motifs & Matches
Match Detail: [Jaspar]
|
| ||
|---|---|---|
| Sites: 100/100 | e-val: 0 | ||
| Factor | e-val(match) | DB |
| TFAP2A | 0.0008748 | JASPAR |
| Zfx | 0.0057924 | JASPAR |
| SP1 | 0.020577 | JASPAR |
| PLAG1 | 0.021165 | JASPAR |
| MIZF | 0.053128 | JASPAR |
|
| ||
| Sites: 94/100 | e-val: 6.09565e-43 | ||
| Factor | e-val(match) | DB |
| PLAG1 | 0.000014675 | JASPAR |
| TFAP2A | 0.000042939 | JASPAR |
| SP1 | 0.00061196 | JASPAR |
| Klf4 | 0.0022597 | JASPAR |
| Zfx | 0.01808 | JASPAR |
|
| ||
| Sites: 56/100 | e-val: 0.000048 | ||
| Factor | e-val(match) | DB |
| SP1 | 0.000031038 | JASPAR |
| TFAP2A | 0.000084836 | JASPAR |
| RREB1 | 0.0045723 | JASPAR |
| Klf4 | 0.0049469 | JASPAR |
| Egr1 | 0.017917 | JASPAR |
BED file downloads
Top 10 Example Regions
| Location | Gene Link | Dist. |
|---|---|---|
| chr9: 132427485-132427635 | PRRX2 | 35.55 |
| chr1: 1052120-1052270 | TNFRSF18 | 41.92 |
| chr1: 1052120-1052270 | AGRN | 41.92 |
| chr1: 1052120-1052270 | MIR200A | 41.92 |
| chr3: 48632620-48632770 | SLC26A6 | 43.74 |
| chr3: 48632620-48632770 | UQCRC1 | 43.74 |
| chr3: 48632620-48632770 | IP6K2 | 43.74 |
| chr8: 143485440-143485590 | TSNARE1 | 46.68 |
| chr17: 7452480-7452630 | AC113189.5 | 55.56 |
| chr7: 45128660-45128810 | NACAD | 55.77 |