SOM cluster: 1202
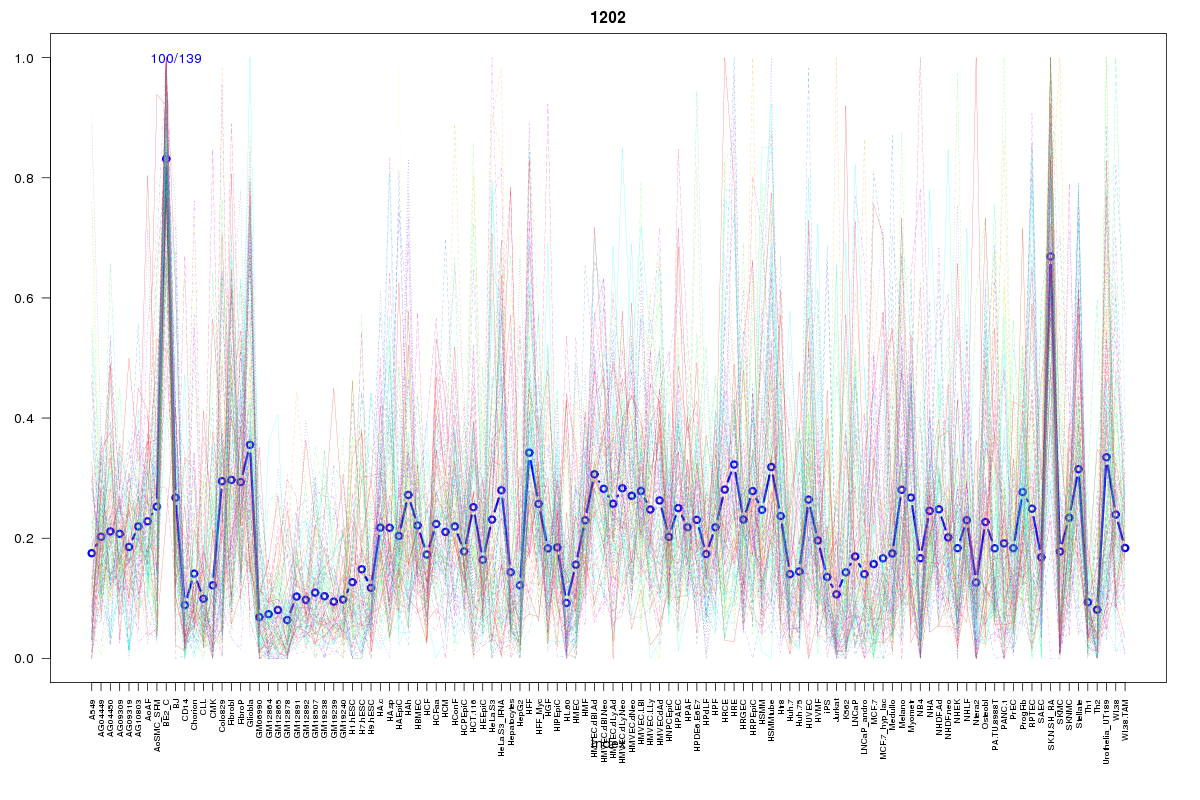
Cluster Hypersensitivity Profile

Genomic Location Trend
These plots show the distribution of the DHS sites surrounding the Transcript Start Site of the nearest gene.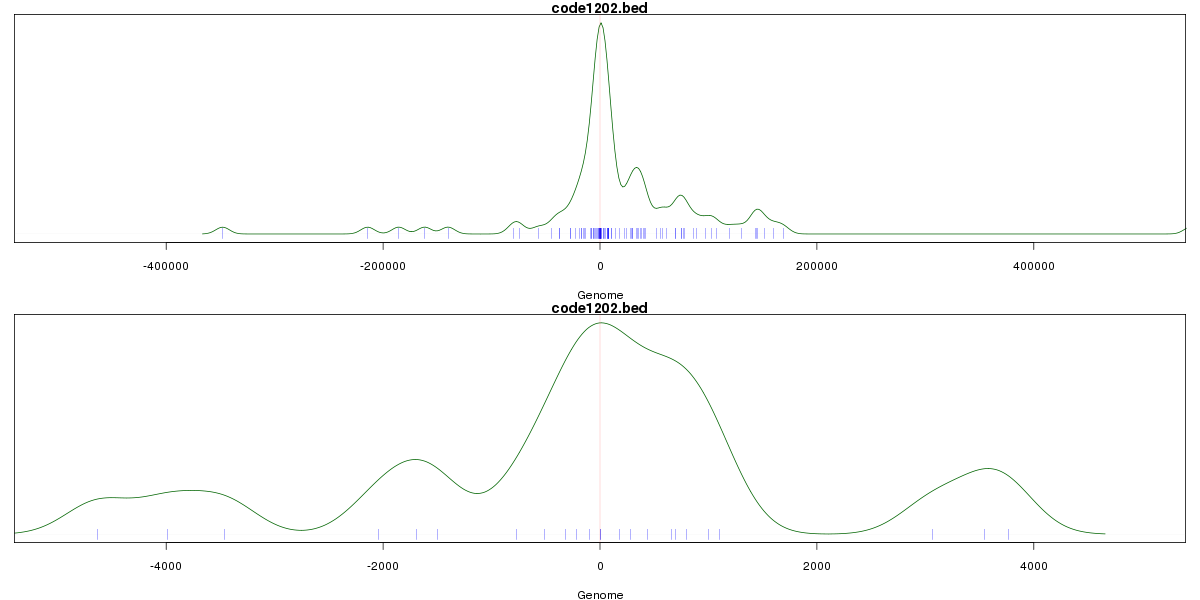
Stats
Number of sites: 139Promoter: 9%
CpG-Island: 1%
Conserved: 47%
Enriched Motifs & Matches
Match Detail: [Jaspar]
|
| ||
|---|---|---|
| Sites: 41/100 | e-val: 0.00000000051 | ||
| Factor | e-val(match) | DB |
| Stat3 | 0.0000043519 | JASPAR |
| EWSR1-FLI1 | 0.0000059996 | JASPAR |
| SPI1 | 0.00035021 | JASPAR |
| FEV | 0.0015191 | JASPAR |
| TLX1::NFIC | 0.0098533 | JASPAR |
|
| ||
| Sites: 64/100 | e-val: 0.000000014 | ||
| Factor | e-val(match) | DB |
| SP1 | 0.000021089 | JASPAR |
| ESR1 | 0.00044325 | JASPAR |
| Klf4 | 0.000839 | JASPAR |
| INSM1 | 0.0041505 | JASPAR |
| ESR2 | 0.0098116 | JASPAR |
|
| ||
| Sites: 32/100 | e-val: 0.09 | ||
| Factor | e-val(match) | DB |
| Myf | 0.00039353 | JASPAR |
| AP1 | 0.0045513 | JASPAR |
| Myc | 0.0052719 | JASPAR |
| SPIB | 0.014517 | JASPAR |
| MYC::MAX | 0.016163 | JASPAR |
|
| ||
| Sites: 21/100 | e-val: 0.0017 | ||
| Factor | e-val(match) | DB |
| SP1 | 0.012732 | JASPAR |
| Myf | 0.013816 | JASPAR |
| Zfp423 | 0.01426 | JASPAR |
| NHLH1 | 0.023424 | JASPAR |
| CTCF | 0.0283 | JASPAR |
BED file downloads
Top 10 Example Regions
| Location | Gene Link | Dist. |
|---|---|---|
| chr9: 130727665-130727815 | AK1 | 50.08 |
| chr9: 130727665-130727815 | PIP5KL1 | 50.08 |
| chr12: 285745-285895 | RP11-283I3.4 | 55.85 |
| chr8: 121873860-121874010 | SNTB1 | 57.47 |
| chr17: 1014880-1015030 | ABR | 64.49 |
| chr17: 1014880-1015030 | AC016292.1 | 64.49 |
| chr16: 66694920-66695070 | CMTM4 | 67.01 |
| chr16: 66694920-66695070 | RP11-61A14.4 | 67.01 |
| chr16: 66694920-66695070 | DYNC1LI2 | 67.01 |
| chr9: 135089780-135089930 | NTNG2 | 68.86 |