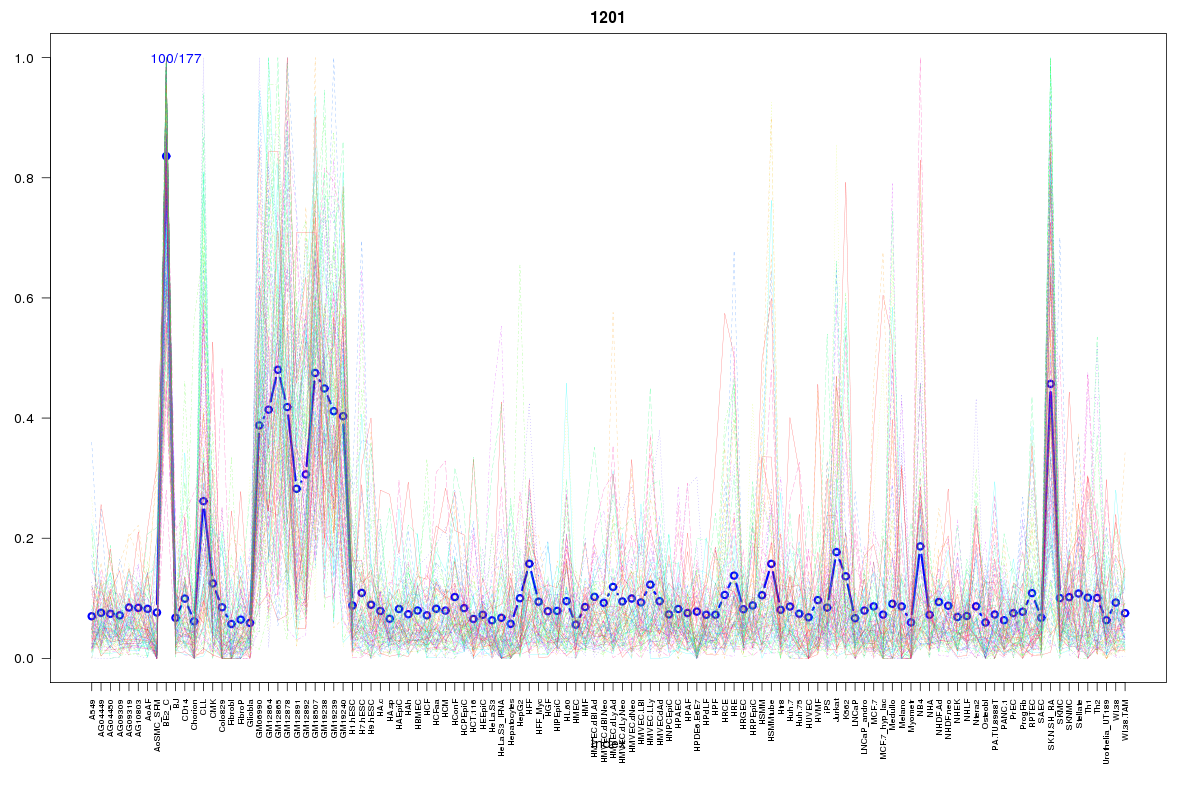
SOM cluster: 1201
Cluster Hypersensitivity Profile

Genomic Location Trend
These plots show the distribution of the DHS sites surrounding the Transcript Start Site of the nearest gene.
Stats
Number of sites: 177Promoter: 3%
CpG-Island: 0%
Conserved: 40%
Enriched Motifs & Matches
Match Detail: [Jaspar]
|
| ||
|---|---|---|
| Sites: 36/100 | e-val: 0.0000000000073 | ||
| Factor | e-val(match) | DB |
| EBF1 | 0.0000012642 | JASPAR |
| PLAG1 | 0.000015869 | JASPAR |
| MZF1_1-4 | 0.00042177 | JASPAR |
| INSM1 | 0.00059488 | JASPAR |
| TFAP2A | 0.0013053 | JASPAR |
|
| ||
| Sites: 23/100 | e-val: 0.83 | ||
| Factor | e-val(match) | DB |
| Myf | 0.00000012863 | JASPAR |
| Zfx | 0.00051712 | JASPAR |
| SP1 | 0.006972 | JASPAR |
| SPIB | 0.0079739 | JASPAR |
| Spz1 | 0.012585 | JASPAR |
|
| ||
| Sites: 29/100 | e-val: 0.26 | ||
| Factor | e-val(match) | DB |
| Tal1::Gata1 | 0.0000039483 | JASPAR |
| PPARG::RXRA | 0.00012525 | JASPAR |
| SP1 | 0.00061857 | JASPAR |
| INSM1 | 0.011642 | JASPAR |
| Pax4 | 0.016719 | JASPAR |
BED file downloads
Top 10 Example Regions
| Location | Gene Link | Dist. |
|---|---|---|
| chr3: 193822080-193822230 | RN7SL215P | 39.92 |
| chr3: 193822080-193822230 | RP11-407B7.1 | 39.92 |
| chr22: 37860360-37860510 | RP1-63G5.5 | 58.96 |
| chr22: 37860360-37860510 | CARD10 | 58.96 |
| chr22: 37860360-37860510 | CDC42EP1 | 58.96 |
| chr22: 37860360-37860510 | ELFN2 | 58.96 |
| chr22: 37860360-37860510 | MFNG | 58.96 |
| chr9: 90173060-90173210 | DAPK1 | 59.82 |
| chr1: 200443320-200443470 | LINC00862 | 62.68 |
| chr1: 11999240-11999390 | NPPB | 66.67 |