SOM cluster: 1198
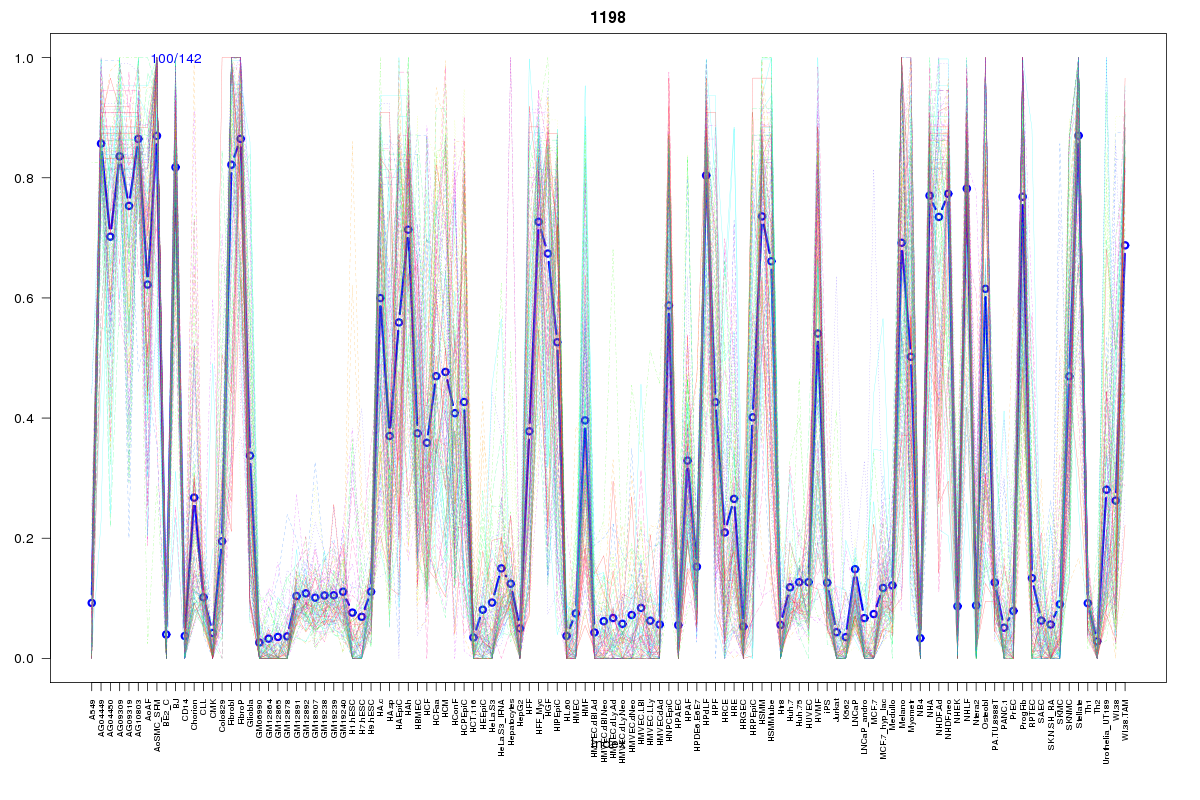
Cluster Hypersensitivity Profile

Genomic Location Trend
These plots show the distribution of the DHS sites surrounding the Transcript Start Site of the nearest gene.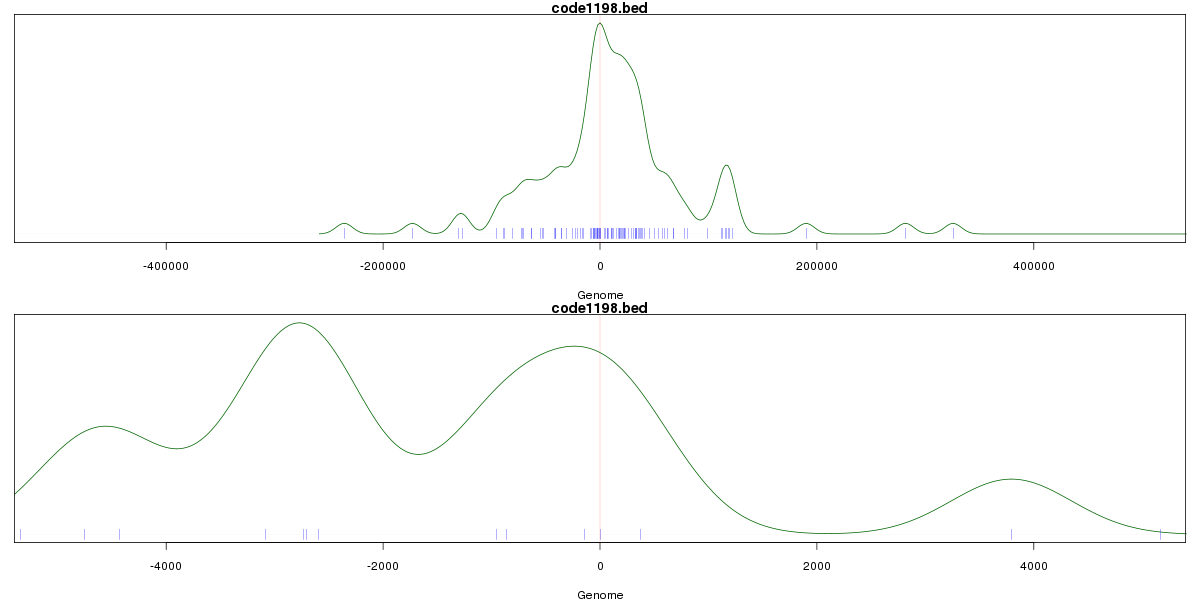
Stats
Number of sites: 142Promoter: 4%
CpG-Island: 0%
Conserved: 48%
Enriched Motifs & Matches
Match Detail: [Jaspar]
|
| ||
|---|---|---|
| Sites: 38/100 | e-val: 0.0000021 | ||
| Factor | e-val(match) | DB |
| RUNX1 | 0.00000012522 | JASPAR |
| INSM1 | 0.010524 | JASPAR |
| SOX10 | 0.016243 | JASPAR |
| ZNF354C | 0.022553 | JASPAR |
| En1 | 0.023032 | JASPAR |
|
| ||
| Sites: 14/100 | e-val: 0.052 | ||
| Factor | e-val(match) | DB |
| HNF1B | 0.00060333 | JASPAR |
| MEF2A | 0.00061471 | JASPAR |
| NKX3-1 | 0.0036305 | JASPAR |
| Foxd3 | 0.011872 | JASPAR |
| Lhx3 | 0.011939 | JASPAR |
|
| ||
| Sites: 19/100 | e-val: 0.0033 | ||
| Factor | e-val(match) | DB |
| TEAD1 | 0.000043212 | JASPAR |
| Foxd3 | 0.00076686 | JASPAR |
| Lhx3 | 0.0010687 | JASPAR |
| MEF2A | 0.0040903 | JASPAR |
| RELA | 0.0090022 | JASPAR |
BED file downloads
Top 10 Example Regions
| Location | Gene Link | Dist. |
|---|---|---|
| chr1: 172938860-172939010 | RP1-15D23.2 | 56.87 |
| chr3: 149191260-149191410 | WWTR1 | 60.35 |
| chr3: 149191260-149191410 | RP11-278L15.3 | 60.35 |
| chr7: 47835265-47835415 | PKD1L1 | 60.94 |
| chr7: 47835265-47835415 | C7orf69 | 60.94 |
| chr10: 88447600-88447750 | RPL7AP8 | 61.82 |
| chr10: 88447600-88447750 | BMPR1A | 61.82 |
| chr19: 2639500-2639650 | GNG7 | 62.35 |
| chr19: 2639500-2639650 | DIRAS1 | 62.35 |
| chr7: 100324780-100324930 | TFR2 | 63.44 |