SOM cluster: 1192
Cluster Hypersensitivity Profile

Genomic Location Trend
These plots show the distribution of the DHS sites surrounding the Transcript Start Site of the nearest gene.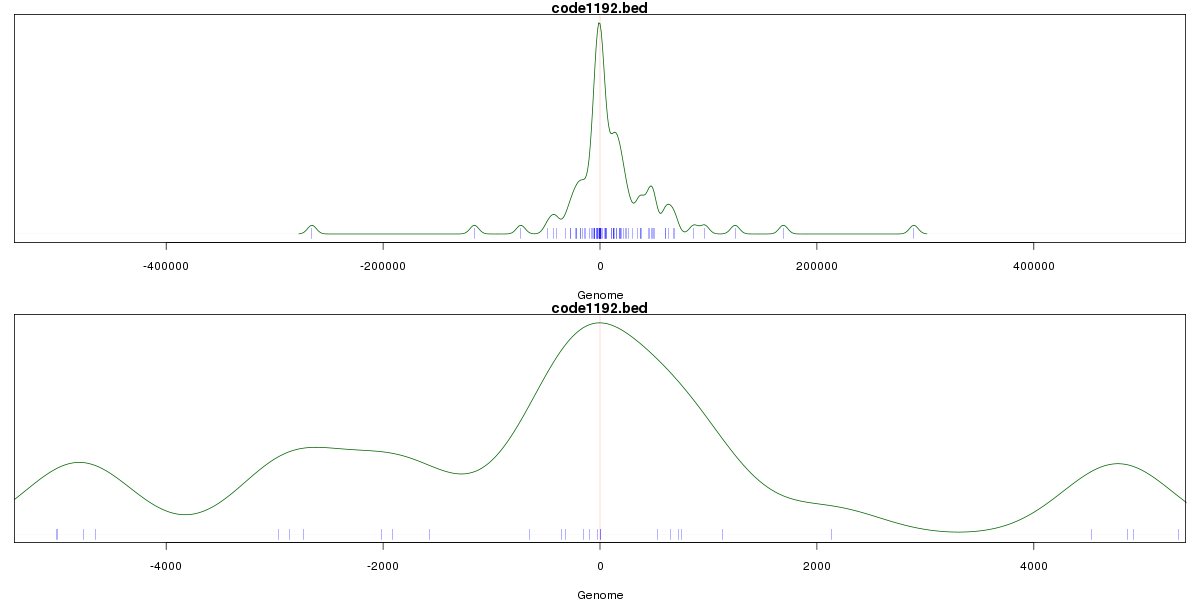
Stats
Number of sites: 90Promoter: 12%
CpG-Island: 0%
Conserved: 28%
Enriched Motifs & Matches
Match Detail: [Jaspar]
|
| ||
|---|---|---|
| Sites: 56/90 | e-val: 7.2e-35 | ||
| Factor | e-val(match) | DB |
| AP1 | 0.00000000095104 | JASPAR |
| NFE2L2 | 0.0000000047859 | JASPAR |
| PPARG | 0.0037344 | JASPAR |
| Pax2 | 0.0043001 | JASPAR |
| NFE2L1::MafG | 0.007686 | JASPAR |
|
| ||
| Sites: 20/90 | e-val: 0.018 | ||
| Factor | e-val(match) | DB |
| SP1 | 0.000034734 | JASPAR |
| SPIB | 0.00061899 | JASPAR |
| SPI1 | 0.00073453 | JASPAR |
| FEV | 0.0034901 | JASPAR |
| RXR::RAR_DR5 | 0.0058099 | JASPAR |
BED file downloads
Top 10 Example Regions
| Location | Gene Link | Dist. |
|---|---|---|
| chr17: 66314505-66314655 | ARSG | 54.06 |
| chr17: 66314505-66314655 | SLC16A6 | 54.06 |
| chr4: 99581385-99581535 | BTF3P13 | 66.64 |
| chr9: 88963460-88963610 | ZCCHC6 | 69.35 |
| chr8: 23398880-23399030 | ENTPD4 | 69.67 |
| chr8: 23398880-23399030 | CTC-756D1.1 | 69.67 |
| chr17: 30772220-30772370 | MYO1D | 70.54 |
| chr17: 30772220-30772370 | Y_RNA | 70.54 |
| chr3: 58203360-58203510 | FLNB | 72.77 |
| chrX: 53292840-53292990 | KDM5C | 75.28 |