SOM cluster: 1191
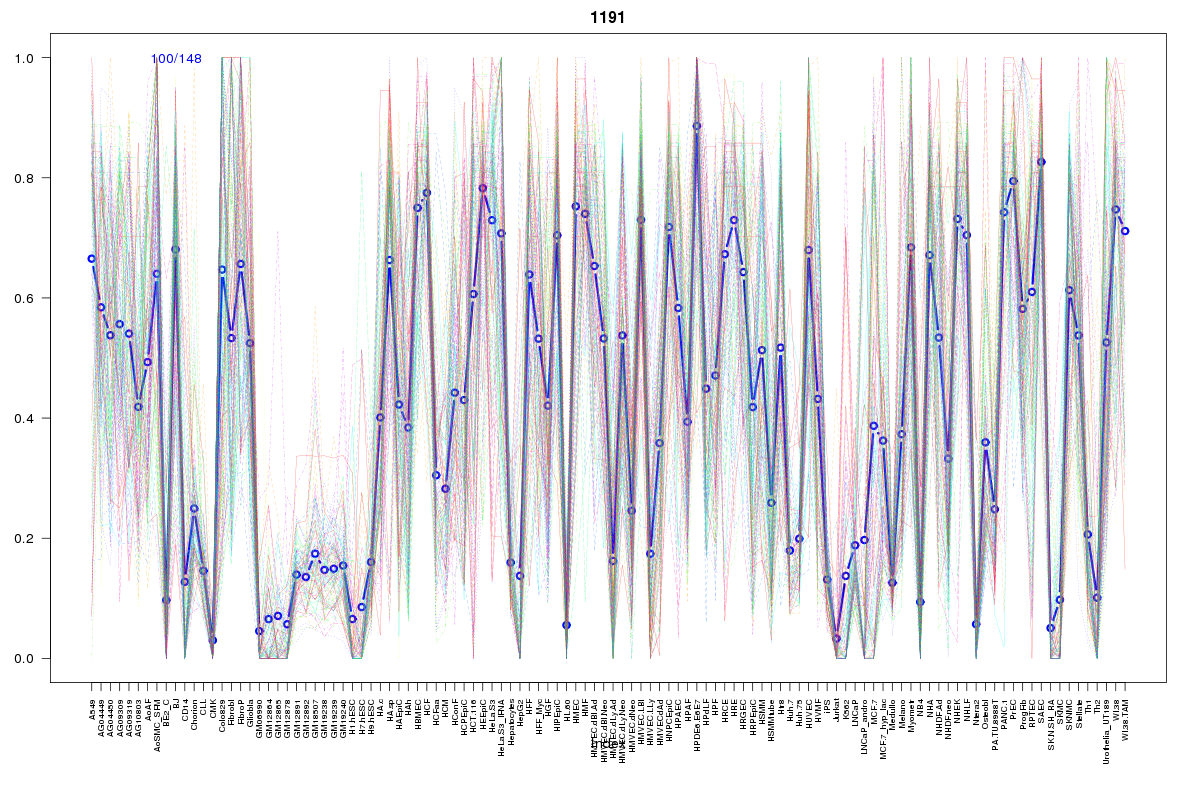
Cluster Hypersensitivity Profile

Genomic Location Trend
These plots show the distribution of the DHS sites surrounding the Transcript Start Site of the nearest gene.
Stats
Number of sites: 148Promoter: 3%
CpG-Island: 0%
Conserved: 43%
Enriched Motifs & Matches
Match Detail: [Jaspar]
|
| ||
|---|---|---|
| Sites: 53/100 | e-val: 2.4e-31 | ||
| Factor | e-val(match) | DB |
| AP1 | 0.000000070394 | JASPAR |
| NFE2L2 | 0.00043631 | JASPAR |
| NFE2L1::MafG | 0.059174 | JASPAR |
| Pdx1 | 0.063618 | JASPAR |
| NKX3-1 | 0.064895 | JASPAR |
BED file downloads
Top 10 Example Regions
| Location | Gene Link | Dist. |
|---|---|---|
| chr1: 183132620-183132770 | LAMC1 | 38.33 |
| chr1: 183132620-183132770 | LAMC2 | 38.33 |
| chr11: 122037960-122038110 | RP11-166D19.1 | 39.86 |
| chr11: 122037960-122038110 | BLID | 39.86 |
| chr11: 122037960-122038110 | RP11-820L6.1 | 39.86 |
| chr8: 18985780-18985930 | PSD3 | 59.19 |
| chr2: 201630420-201630570 | Y_RNA | 63.67 |
| chr2: 201630420-201630570 | AC007163.3 | 63.67 |
| chr15: 71588065-71588215 | THSD4 | 65.14 |
| chr3: 172234680-172234830 | GHSR | 68.78 |