SOM cluster: 1184
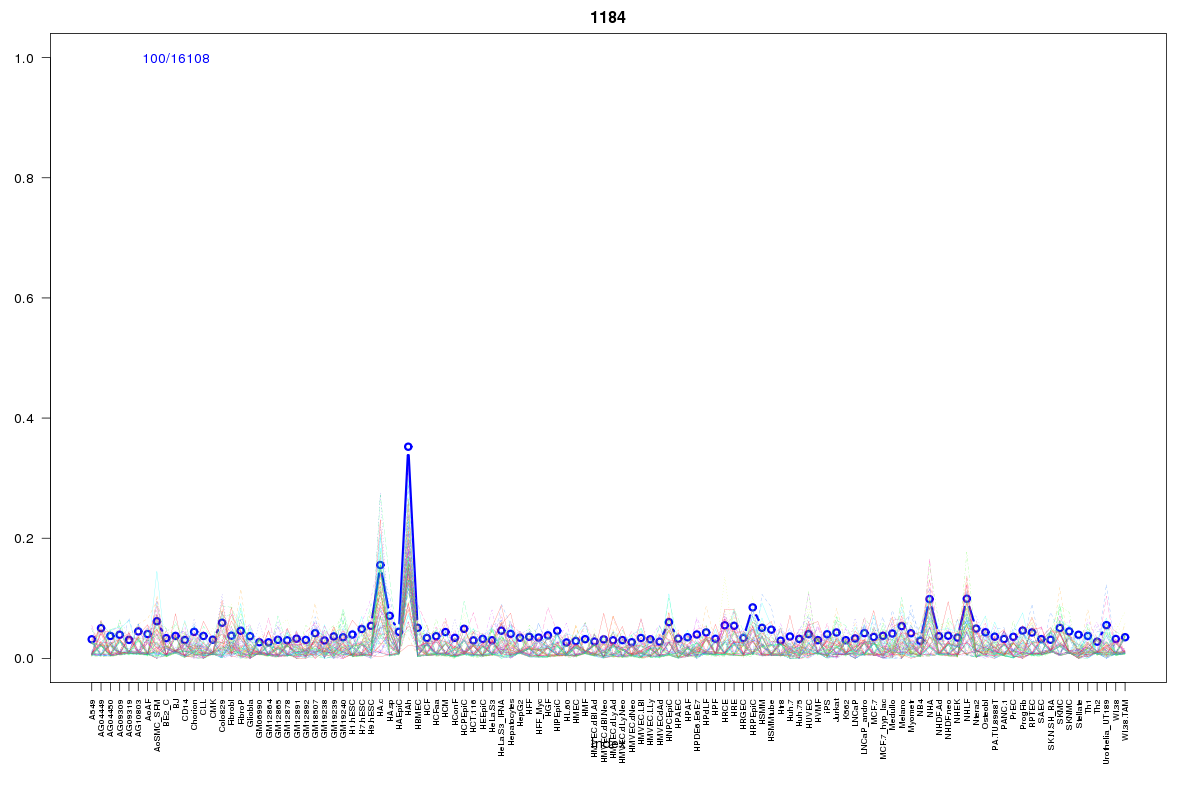
Cluster Hypersensitivity Profile

Genomic Location Trend
These plots show the distribution of the DHS sites surrounding the Transcript Start Site of the nearest gene.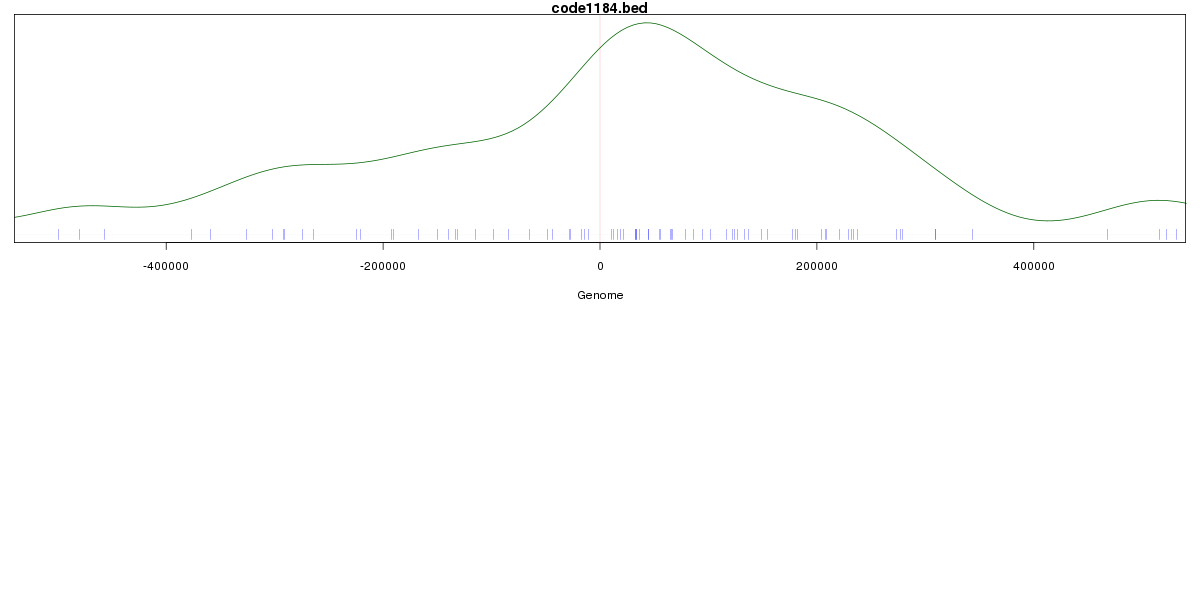
Stats
Number of sites: 16108Promoter: 0%
CpG-Island: 0%
Conserved: 24%
Enriched Motifs & Matches
Match Detail: [Jaspar]
|
| ||
|---|---|---|
| Sites: 19/100 | e-val: 0.0022 | ||
| Factor | e-val(match) | DB |
| Foxq1 | 0.0016929 | JASPAR |
| Pax4 | 0.0017306 | JASPAR |
| Foxd3 | 0.0033846 | JASPAR |
| HNF1A | 0.0043533 | JASPAR |
| ARID3A | 0.0047132 | JASPAR |
BED file downloads
Top 10 Example Regions
| Location | Gene Link | Dist. |
|---|---|---|
| chr1: 210555380-210555530 | HHAT | 26.99 |
| chr7: 33194460-33194610 | AC074338.5 | 29.07 |
| chr12: 24074600-24074750 | SOX5 | 36.56 |
| chr5: 115150900-115151050 | CDO1 | 39.25 |
| chr10: 13042360-13042510 | CCDC3 | 39.64 |
| chr8: 38941500-38941650 | ADAM32 | 40.96 |
| chr9: 127452600-127452750 | MIR181A2HG | 41.51 |
| chr8: 94871040-94871190 | PDP1 | 41.86 |
| chr18: 43309040-43309190 | SLC14A2 | 42.6 |
| chr8: 60022000-60022150 | TOX | 45.02 |