SOM cluster: 1174
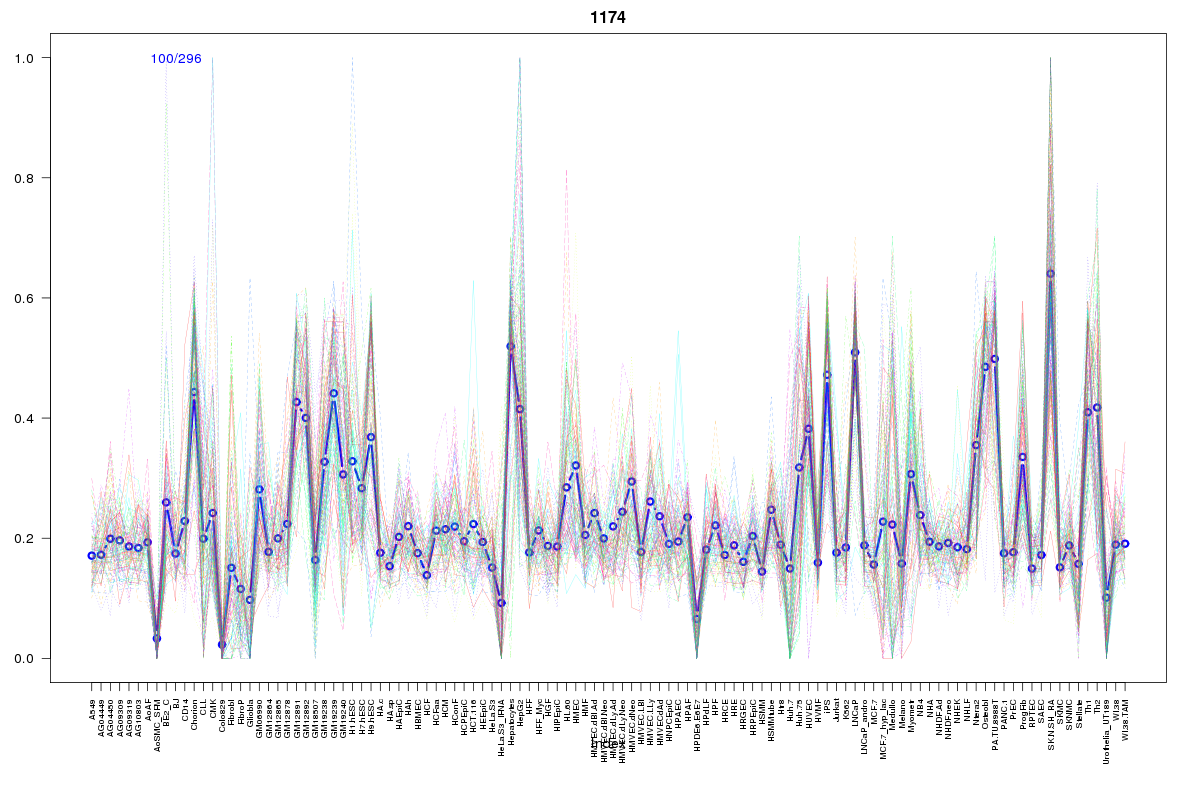
Cluster Hypersensitivity Profile

Genomic Location Trend
These plots show the distribution of the DHS sites surrounding the Transcript Start Site of the nearest gene.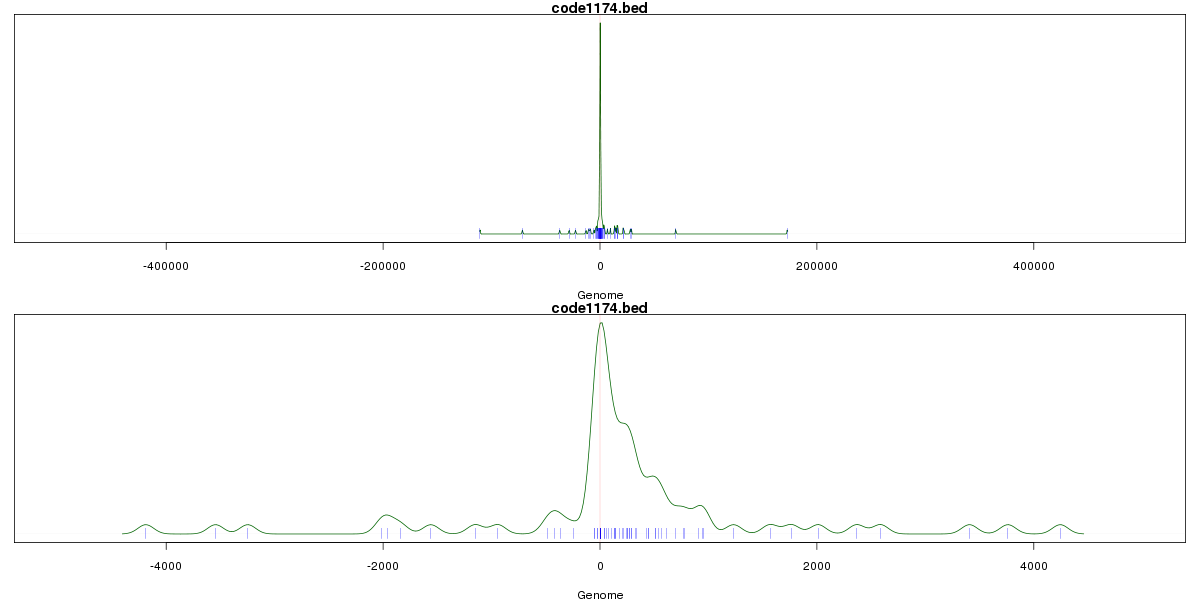
Stats
Number of sites: 296Promoter: 30%
CpG-Island: 82%
Conserved: 70%
Enriched Motifs & Matches
Match Detail: [Jaspar]
|
| ||
|---|---|---|
| Sites: 96/100 | e-val: 0 | ||
| Factor | e-val(match) | DB |
| SP1 | 0.000057542 | JASPAR |
| TFAP2A | 0.00013181 | JASPAR |
| PLAG1 | 0.034758 | JASPAR |
| Egr1 | 0.049814 | JASPAR |
| Zfx | 0.066813 | JASPAR |
|
| ||
| Sites: 72/100 | e-val: 1.7e-35 | ||
| Factor | e-val(match) | DB |
| SP1 | 0.000075058 | JASPAR |
| TFAP2A | 0.00024947 | JASPAR |
| Egr1 | 0.0088455 | JASPAR |
| PLAG1 | 0.030998 | JASPAR |
| RREB1 | 0.045242 | JASPAR |
|
| ||
| Sites: 36/100 | e-val: 0.041 | ||
| Factor | e-val(match) | DB |
| SP1 | 0.0000054515 | JASPAR |
| RXR::RAR_DR5 | 0.0020478 | JASPAR |
| MZF1_1-4 | 0.0044281 | JASPAR |
| Egr1 | 0.0086085 | JASPAR |
| Klf4 | 0.0124 | JASPAR |
BED file downloads
Top 10 Example Regions
| Location | Gene Link | Dist. |
|---|---|---|
| chr2: 26396285-26396435 | PPIL1P1 | 31.48 |
| chr17: 64961405-64961555 | CACNG4 | 38.86 |
| chr1: 32238405-32238555 | BAI2 | 62.62 |
| chr9: 92220380-92220530 | GADD45G | 64.68 |
| chr9: 92220380-92220530 | RP11-316P17.2 | 64.68 |
| chr11: 2906565-2906715 | KCNQ1-AS1 | 65.63 |
| chr8: 144649560-144649710 | RP11-661A12.5 | 67.87 |
| chr8: 144649560-144649710 | ZNF623 | 67.87 |
| chr12: 95043725-95043875 | TMCC3 | 68.34 |
| chr16: 4744620-4744770 | UBALD1 | 69.76 |