SOM cluster: 1171
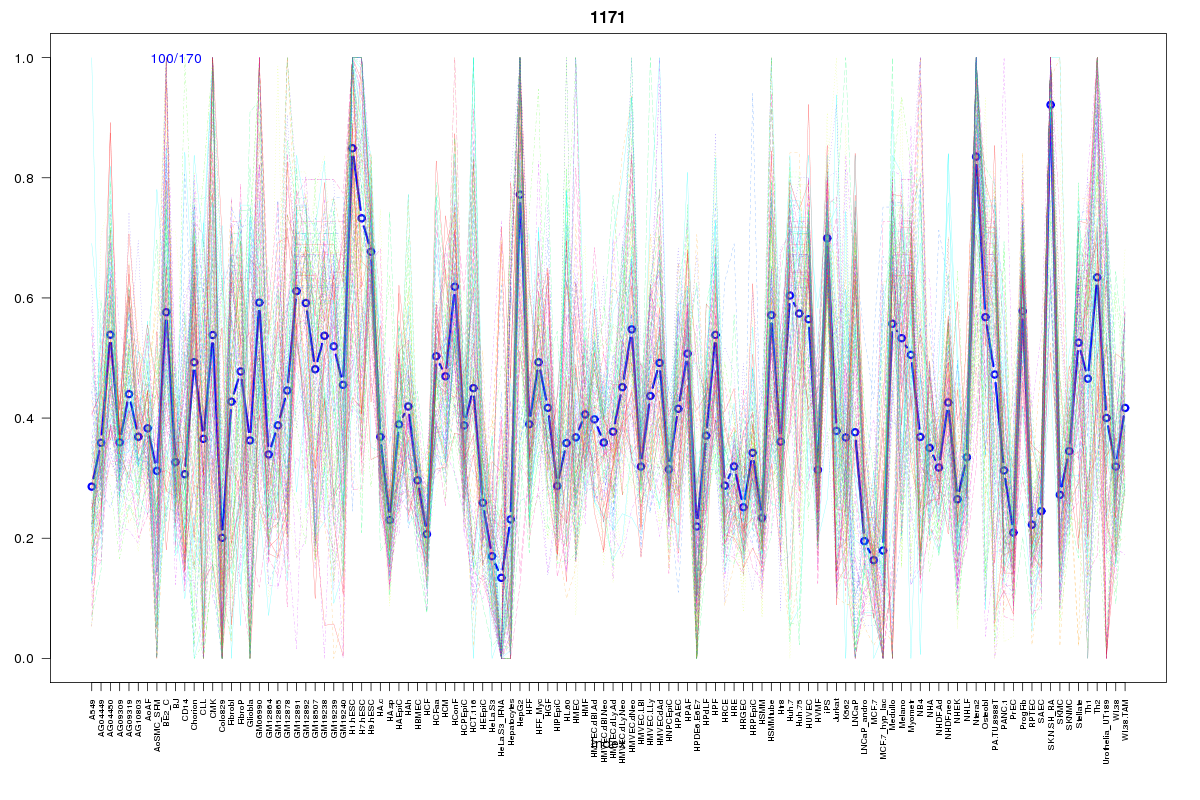
Cluster Hypersensitivity Profile

Genomic Location Trend
These plots show the distribution of the DHS sites surrounding the Transcript Start Site of the nearest gene.
Stats
Number of sites: 170Promoter: 52%
CpG-Island: 85%
Conserved: 76%
Enriched Motifs & Matches
Match Detail: [Jaspar]
|
| ||
|---|---|---|
| Sites: 99/100 | e-val: 0 | ||
| Factor | e-val(match) | DB |
| SP1 | 0.00000000025821 | JASPAR |
| Klf4 | 0.00011308 | JASPAR |
| TFAP2A | 0.0026745 | JASPAR |
| INSM1 | 0.012587 | JASPAR |
| RREB1 | 0.013187 | JASPAR |
|
| ||
| Sites: 83/100 | e-val: 8.70206e-43 | ||
| Factor | e-val(match) | DB |
| SP1 | 0.0000029193 | JASPAR |
| TFAP2A | 0.0072624 | JASPAR |
| Pax4 | 0.0095225 | JASPAR |
| Klf4 | 0.013269 | JASPAR |
| Egr1 | 0.045434 | JASPAR |
|
| ||
| Sites: 52/100 | e-val: 0.00000000025 | ||
| Factor | e-val(match) | DB |
| TFAP2A | 0.00000040983 | JASPAR |
| SP1 | 0.00012947 | JASPAR |
| Zfx | 0.0040738 | JASPAR |
| MZF1_1-4 | 0.0095546 | JASPAR |
| REST | 0.021023 | JASPAR |
BED file downloads
Top 10 Example Regions
| Location | Gene Link | Dist. |
|---|---|---|
| chr1: 145474440-145474590 | ANKRD34A | 13.02 |
| chr1: 145474440-145474590 | PEX11B | 13.02 |
| chr1: 204797660-204797810 | NFASC | 49.65 |
| chr1: 246887280-246887430 | SCCPDH | 51.08 |
| chr1: 246887280-246887430 | CNST | 51.08 |
| chr1: 160040020-160040170 | RP11-536C5.2 | 61.37 |
| chr1: 160040020-160040170 | LINC01133 | 61.37 |
| chrX: 103173680-103173830 | TMSB15B | 62.28 |
| chr12: 27932780-27932930 | RP11-860B13.1 | 62.44 |
| chr19: 1450000-1450150 | MUM1 | 62.87 |