SOM cluster: 1160
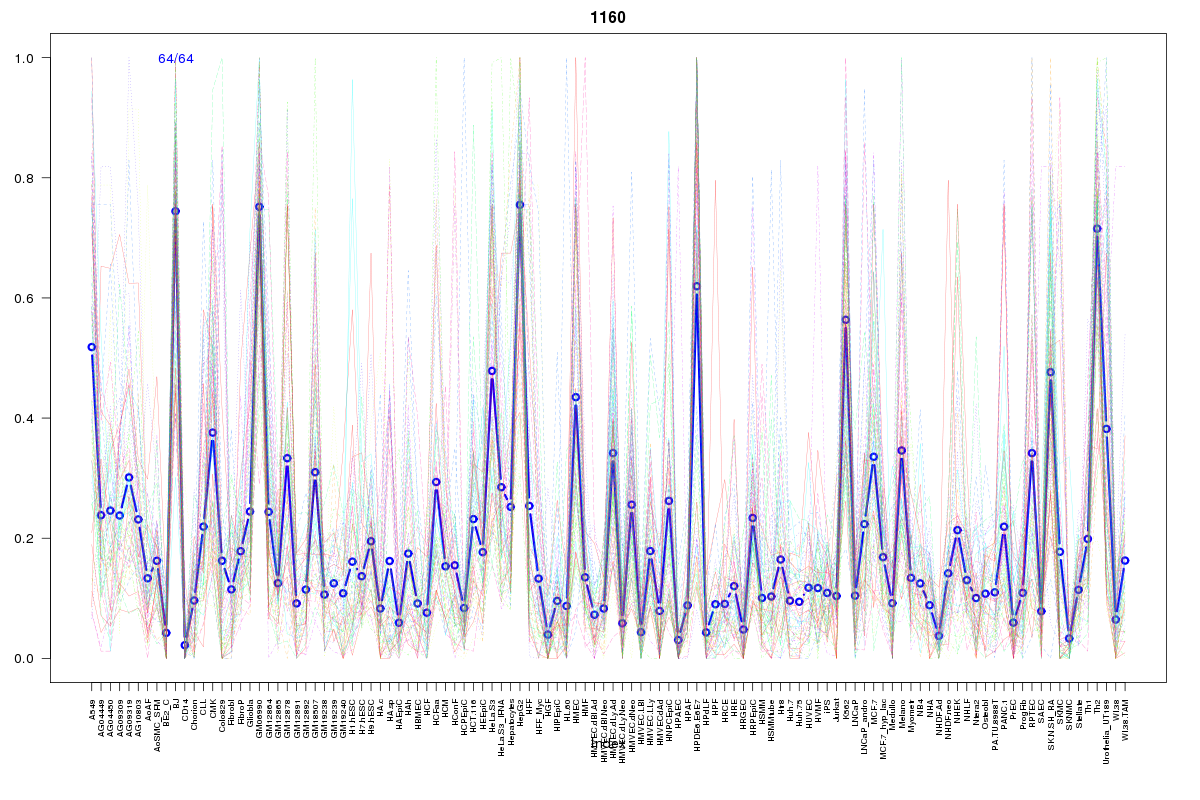
Cluster Hypersensitivity Profile

Genomic Location Trend
These plots show the distribution of the DHS sites surrounding the Transcript Start Site of the nearest gene.
Stats
Number of sites: 64Promoter: 11%
CpG-Island: 0%
Conserved: 57%
Enriched Motifs & Matches
Match Detail: [Jaspar]
|
| ||
|---|---|---|
| Sites: 30/64 | e-val: 0.000000000016 | ||
| Factor | e-val(match) | DB |
| MEF2A | 0.0000031915 | JASPAR |
| Nkx2-5 | 0.008251 | JASPAR |
| Foxq1 | 0.027026 | JASPAR |
| ARID3A | 0.037429 | JASPAR |
| HNF1B | 0.062419 | JASPAR |
|
| ||
| Sites: 15/64 | e-val: 0.000000018 | ||
| Factor | e-val(match) | DB |
| Tcfcp2l1 | 0.0022811 | JASPAR |
| T | 0.010232 | JASPAR |
| FOXA1 | 0.018872 | JASPAR |
| TLX1::NFIC | 0.019359 | JASPAR |
| NKX3-1 | 0.034524 | JASPAR |
|
| ||
| Sites: 41/64 | e-val: 0.000028 | ||
| Factor | e-val(match) | DB |
| MEF2A | 0.001505 | JASPAR |
| NKX3-1 | 0.0073857 | JASPAR |
| znf143 | 0.012221 | JASPAR |
| REL | 0.038827 | JASPAR |
| Ar | 0.050001 | JASPAR |
|
| ||
| Sites: 9/64 | e-val: 0.00000028 | ||
| Factor | e-val(match) | DB |
| FEV | 0.0015011 | JASPAR |
| Pax4 | 0.0040359 | JASPAR |
| Foxq1 | 0.057105 | JASPAR |
| HNF1B | 0.063562 | JASPAR |
| ARID3A | 0.070752 | JASPAR |
|
| ||
| Sites: 11/64 | e-val: 0.011 | ||
| Factor | e-val(match) | DB |
| Foxd3 | 0.0022469 | JASPAR |
| Foxq1 | 0.0041099 | JASPAR |
| Pax4 | 0.0087224 | JASPAR |
| HNF1A | 0.016707 | JASPAR |
| IRF1 | 0.01767 | JASPAR |