SOM cluster: 1155
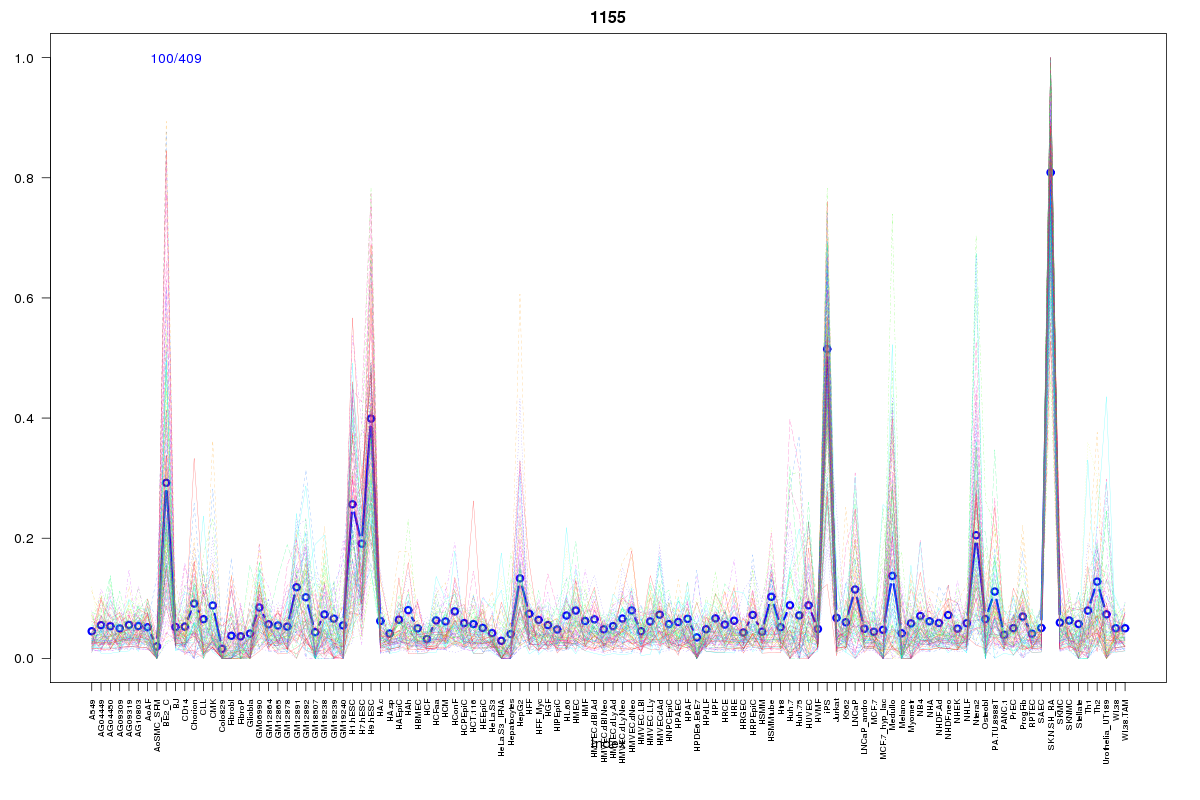
Cluster Hypersensitivity Profile

Genomic Location Trend
These plots show the distribution of the DHS sites surrounding the Transcript Start Site of the nearest gene.
Stats
Number of sites: 409Promoter: 19%
CpG-Island: 51%
Conserved: 70%
Enriched Motifs & Matches
Match Detail: [Jaspar]
|
| ||
|---|---|---|
| Sites: 95/100 | e-val: 0 | ||
| Factor | e-val(match) | DB |
| SP1 | 0.00000010782 | JASPAR |
| PLAG1 | 0.0000050973 | JASPAR |
| RREB1 | 0.00055276 | JASPAR |
| TFAP2A | 0.0067795 | JASPAR |
| Klf4 | 0.0080898 | JASPAR |
|
| ||
| Sites: 83/100 | e-val: 1.9e-35 | ||
| Factor | e-val(match) | DB |
| NHLH1 | 0.00090735 | JASPAR |
| TFAP2A | 0.0010313 | JASPAR |
| Myf | 0.0044489 | JASPAR |
| SP1 | 0.010701 | JASPAR |
| Zfx | 0.020226 | JASPAR |
|
| ||
| Sites: 38/100 | e-val: 0.00011 | ||
| Factor | e-val(match) | DB |
| SP1 | 0.00000055759 | JASPAR |
| Tcfcp2l1 | 0.0014249 | JASPAR |
| Tal1::Gata1 | 0.0022702 | JASPAR |
| MZF1_5-13 | 0.0027024 | JASPAR |
| INSM1 | 0.0047397 | JASPAR |
BED file downloads
Top 10 Example Regions
| Location | Gene Link | Dist. |
|---|---|---|
| chr8: 80525185-80525335 | STMN2 | 42.75 |
| chr1: 160380185-160380335 | VANGL2 | 44.48 |
| chr20: 43434580-43434730 | RIMS4 | 49.04 |
| chr20: 43434580-43434730 | RP11-445H22.4 | 49.04 |
| chrX: 54948425-54948575 | TRO | 51.3 |
| chrX: 51239625-51239775 | CXorf67 | 51.71 |
| chr3: 36805965-36806115 | TRANK1 | 53.52 |
| chr4: 41747445-41747595 | PHOX2B | 58.44 |
| chr4: 41747445-41747595 | RP11-227F19.1 | 58.44 |
| chr15: 79575065-79575215 | TMED3 | 59.64 |