SOM cluster: 1154
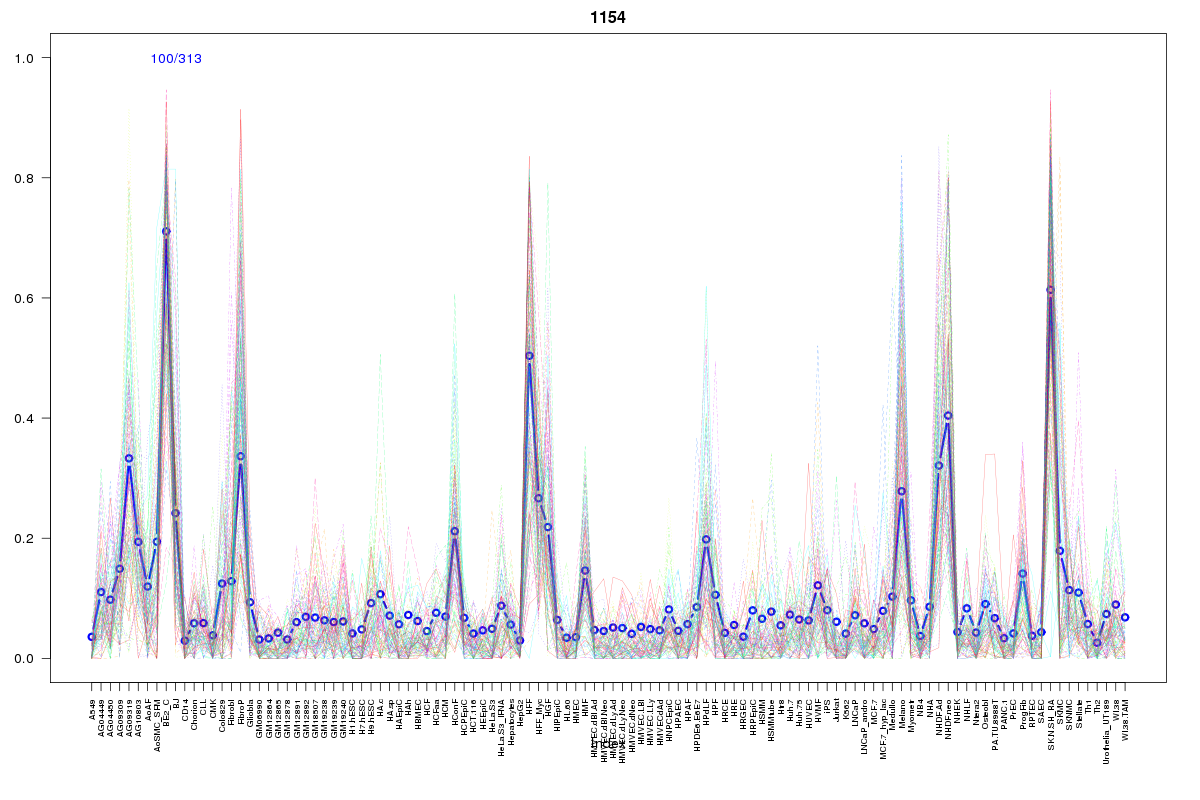
Cluster Hypersensitivity Profile

Genomic Location Trend
These plots show the distribution of the DHS sites surrounding the Transcript Start Site of the nearest gene.
Stats
Number of sites: 313Promoter: 0%
CpG-Island: 0%
Conserved: 61%
Enriched Motifs & Matches
Match Detail: [Jaspar]
|
| ||
|---|---|---|
| Sites: 47/100 | e-val: 1.9e-37 | ||
| Factor | e-val(match) | DB |
| TAL1::TCF3 | 0.000013178 | JASPAR |
| ARID3A | 0.00028816 | JASPAR |
| Prrx2 | 0.00036139 | JASPAR |
| HNF1A | 0.0010316 | JASPAR |
| Lhx3 | 0.0011694 | JASPAR |
BED file downloads
Top 10 Example Regions
| Location | Gene Link | Dist. |
|---|---|---|
| chr9: 139256260-139256410 | GPSM1 | 47.28 |
| chr11: 14604880-14605030 | PSMA1 | 47.39 |
| chr11: 14604880-14605030 | PSMA1 | 47.39 |
| chr5: 168081200-168081350 | CTC-558O2.1 | 55.11 |
| chr5: 168081200-168081350 | SLIT3 | 55.11 |
| chr6: 41457340-41457490 | FOXP4 | 58.58 |
| chr8: 93032300-93032450 | RUNX1T1 | 70.73 |
| chr11: 7584620-7584770 | OLFML1 | 73.55 |
| chr7: 28116480-28116630 | JAZF1 | 75.47 |
| chr8: 93467780-93467930 | RP11-700E23.1 | 75.77 |